Hi!
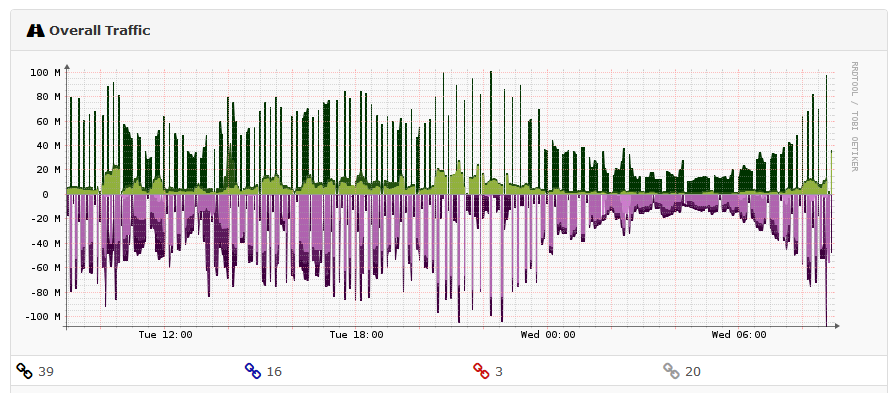
I’m having some gaps on overall traffic graphs like that:
I only have this issue on routers with high traffic load (more than 60Mbps on a Fast ehternet interface). Those routers are Cisco C3560, Cisco C800 or Juniper SRX210. Anyone could give me some advice on where to look for?
Thanks in advance
Hi,
try this:
https://docs.librenms.org/#Support/Performance/
check IOPS on disk (RRDdata), load on devices and try disable unused modules for devices.
If these devices are using snmp v1 then change to v2c or v3.
I’ve changed from v1 to v2c and I’ve disabled unused modules. The poller time has improved a little from 5s avg to 3s, but I still see the same behaviour. It only happens on the traffic graphs, the other graphs doesn’t have those gaps.
hi,
try disabled other snmp client in device. (For me - that’s work for Cisco SG500). Check load on this device.
Thanks Kevin,
I think the correct link is that: https://docs.librenms.org/#Support/FAQ/#faq17
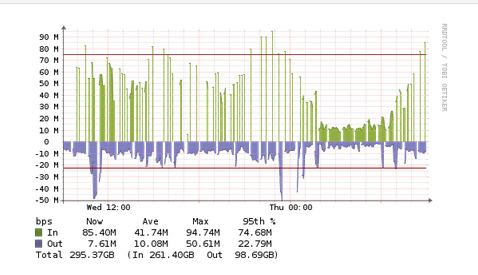
I’ve checket the poller and all the devices are checked within 300 seconds:
I’m also running RRDCached, which improved significatively the IOPS performance.
I only have those gaps on traffic graphs and only on the bussiest interfaces
I do not use pdns-recrursor, do you think it worth to use it?
Are you 100% sure you are using v2c now? Those graphs look like it’s v1 to me.
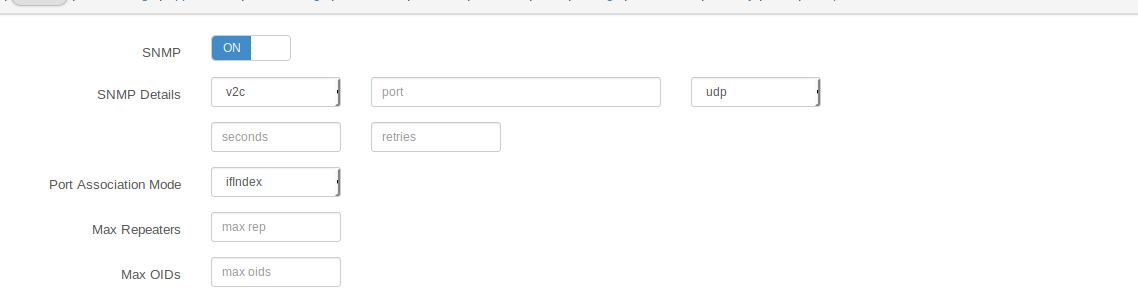
Yes, I’m using v2c but with the default values:
do you recommend to change the Port Association Mode, Max Repeater or Max OIDs?
No those don’t have to be changed.
Maybe check the firmware the device is running, could have a bug.