I want to draw librenms graphs in grafana without doubling data using influxdb.
I have now one solution but it’s not the best.
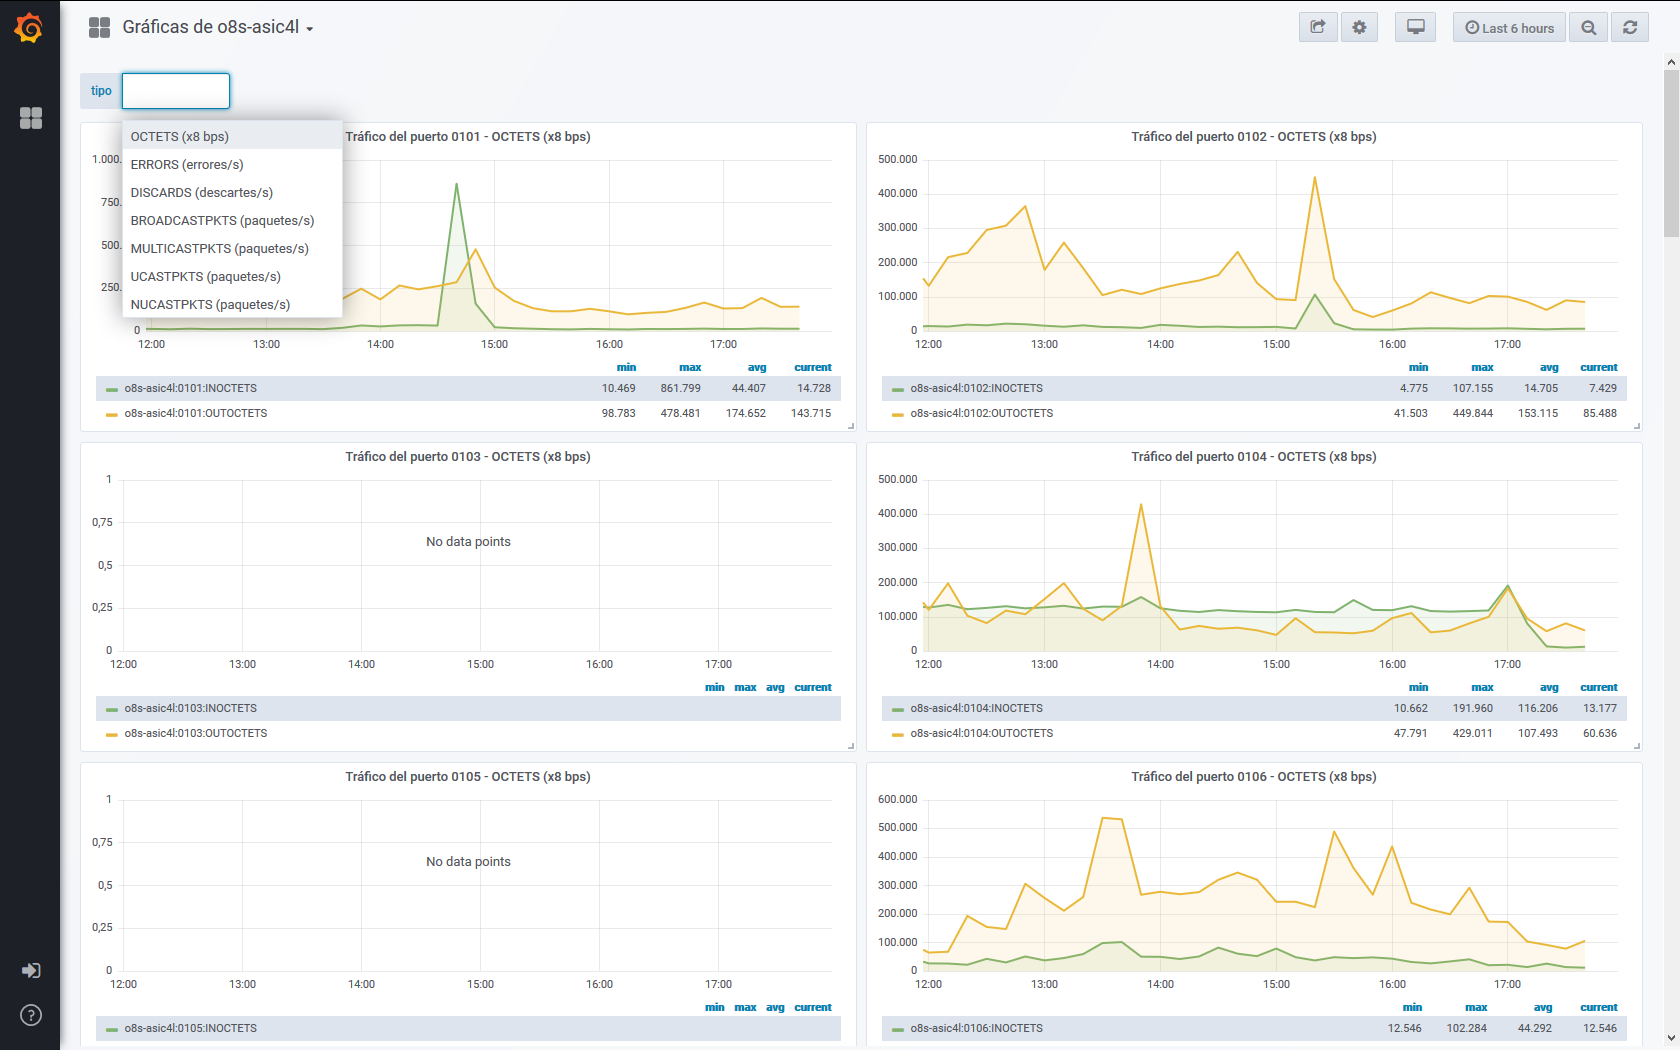
We are serving rrds directly with grafana-rrd-server and then importing with simple json plugin and drawing with scripted dashboards of grafana.
- Create soft links of rrds (port_name.rrd instead of port_id.rrd) because is the name of the serie in grafana-rrd-server
- Serving rrds with grafana-rrd-server to localhost.
- I have two datasources, one for octects because (octect=8 bits) and one for rest of data (error=1 error)
- Generate dashboard with scripted dashboards.
¿Anyone knows another way?
Good luck, I’m pretty sure you are in uncharted territory. Most everyone just uses another tsdb in conjunction with Grafana.
Jejeje.
I suposed it, but if I write it in a post anyone can search for it.
It’s working good.
Requirements:
Grafana-rrd-server service example:
[Unit]
Description=Grafana RRD Server (librenms RRDs)
After=network.service
[Service]
User=librenms
Group=librenms
ExecStart=/usr/bin/grafana-rrd-server -p 9001 -r /opt/librenms/rrd/ -s 600 &
[Install]
WantedBy=default.target
Create new simple json datasource with:
http://localhost:9001
You can draw series with devicefolder:rrdfilewithout.rrd:seriename example device1:port-id1:INOCTETS