Hi,
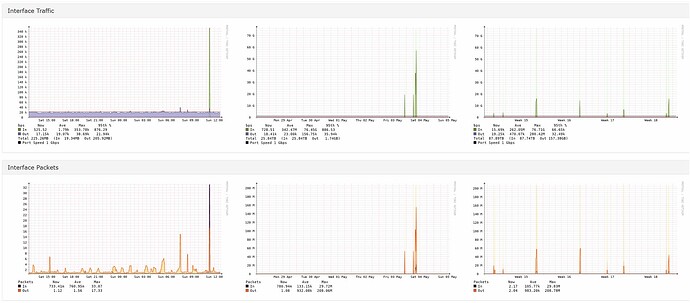
Why am I getting graphs beyond the port speed? It seems the daily graph is ok but graphs which are more than a day seems wrong.
All graphs were fine a few months ago.
(this graph is from a 1gbps port of a Cisco 3850 switch, but most of the ports have this issue)
The output of ./validate.php
===========================================
Component | Version
--------- | -------
LibreNMS  | 24.4.1 (2024-04-20T17:56:51+03:30)
DB Schema | 2024_04_10_093513_remove_device_perf (291)
PHP       | 8.1.12
Python    | 3.6.8
Database  | MariaDB 10.5.17-MariaDB
RRDTool   | 1.7.1
SNMP      | 5.7.2
===========================================

[OK]    Composer Version: 2.7.4
[OK]    Dependencies up-to-date.
[OK]    Database connection successful
[OK]    Database Schema is current
[OK]    SQL Server meets minimum requirements
[OK]    lower_case_table_names is enabled
[OK]    MySQL engine is optimal
[OK]    Database and column collations are correct
[OK]    Database schema correct
[OK]    MySQL and PHP time match
[OK]    Active pollers found
[OK]    Dispatcher Service not detected
[OK]    Locks are functional
[OK]    Python poller wrapper is polling
[OK]    Redis is unavailable
[OK]    rrdtool version ok
[OK]    Connected to rrdcached
