Graph not appear for device client

Hi,

I have some issue where the graph is not appear on client side, for the librenms server the graph is appear. I used the librenms from vmdk image. My server libre is centos 7 with nginx and my client is centos6.x
i already check but not get the clue where the error is, i am new for rrdtools.
this is the validate.php output and rrd command for graph : https://p.libren.ms/view/c5bfdc3e

where i must check the error issue? i know my libre is not update but i think for the graph it might be not an issue for update

my client is use default snmpd.conf, is any snmpd.conf i need to change for the graph work?

Thanks,

Are all graphs not working or is just one particular graph?

Also, you should really consider updating your install.

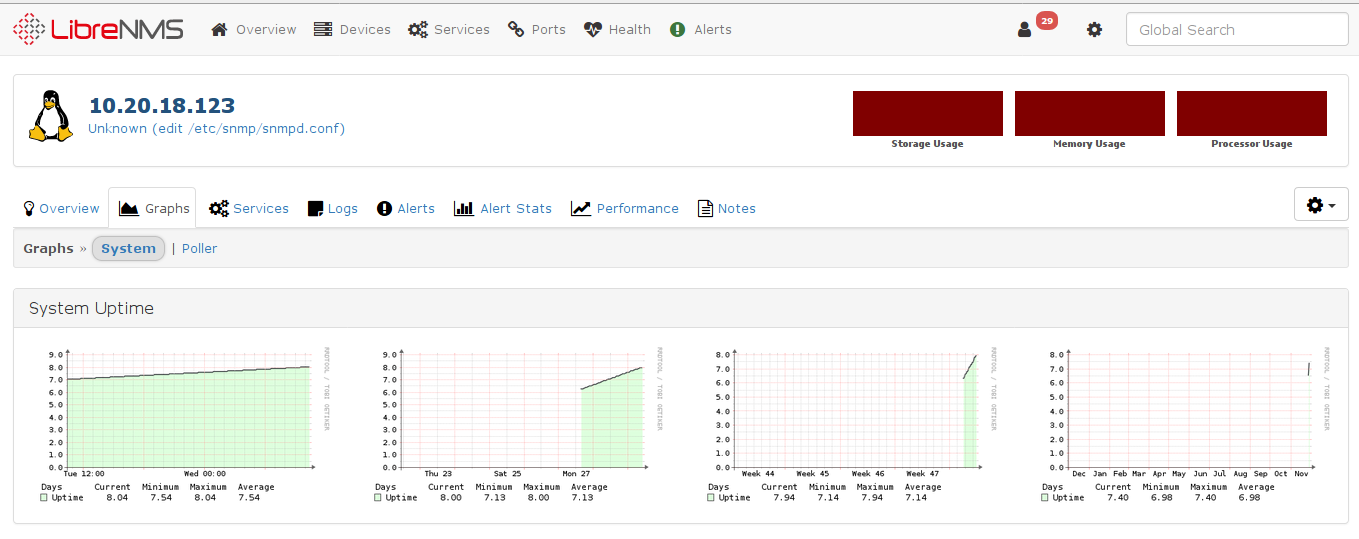
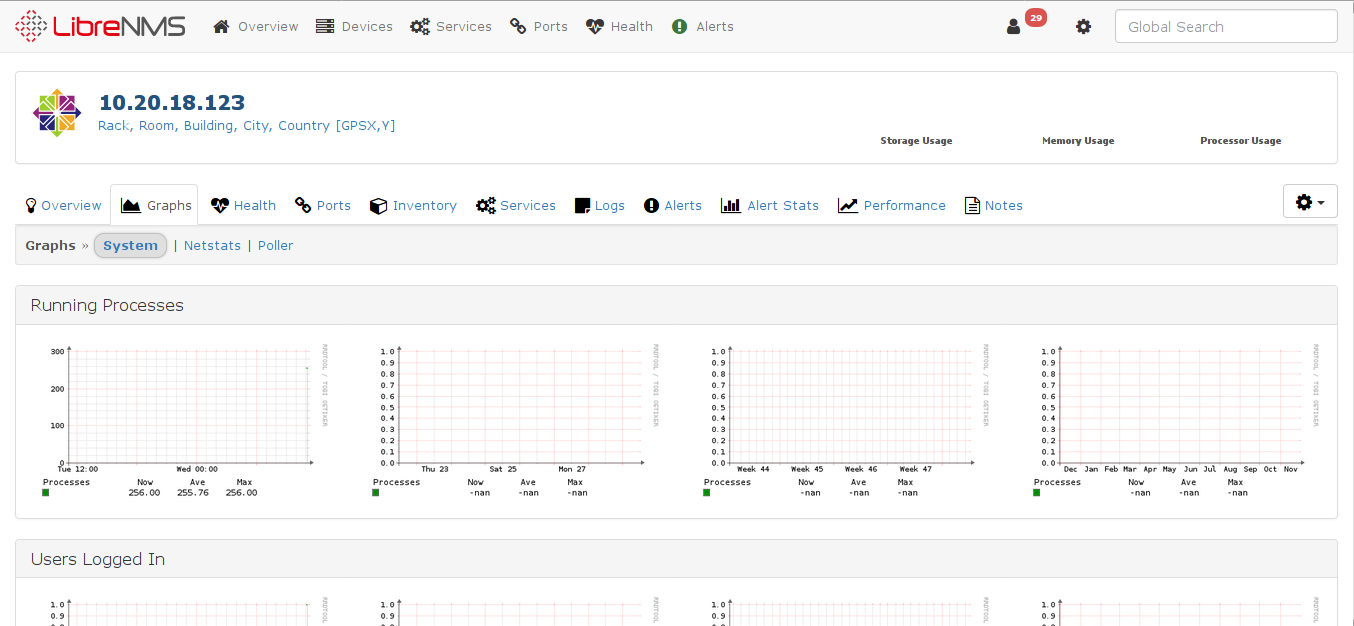
all graph is not working for client device but for librenms server is fine, the error at libre server can not graph but is ok when i change the date on server, but i check on my client server the date is update.

should i update the libre server?

thanks,

Yes, absolutely you should there have been lots of fixes and changes since then.

run a poller debug and pastebin the output please.

./poller.php -h HOSTNAME -d

ok i will try to update the server. After that what i must to do after update the server to see and check the graph for client device?

thanks

Update then do what i posted up ^^ poller debug so we can what is going on with that device

Hi,

i already update the libre with daily.sh script, this is the ouput for daily.sh and vaildate.php :

https://p.libren.ms/view/710f4e8a

and this for poller.php :
https://p.libren.ms/view/fa95a7a4

the graph is appear for some poller but not for the storage, memory processor usage.

thanks…

Good.

okay, can you post also discovery debug also please?

./discovery.php -h HOSTNAME -d

hi kevin,

thanks for the fast response,

this is the output :

https://p.libren.ms/view/8fe15afa

also, your snmpd.conf on that server has some errors in it I suggest you fix that also

Use our how-to for that -> https://docs.librenms.org/#Support/SNMP-Configuration-Examples/#operating-systems

it is my snmpd.conf and it same like the link on my server because it is from the vmdk
https://p.libren.ms/view/071ad266

where is the error clue for this issue? can you mention it?

thanks

Im talking about the device you are polling from not the snmpd on the LibreNMS server.
You can see just a few errors in the poller.

Also, you can look through the poller debug and discovery debug for errors and in your case you are trying to look for the disocvery module for memory and processor and storage.

Hi Kevin,

I already update the snmpd for the client and now the graph is appear but not grep yet i will wait till tommorow for the graphing.

this is the rrdtools output :

https://p.libren.ms/view/129d72b2

but i still curious where is the output for error from the poller and discovery debug output, can you highlight the error for example?

thanks for the guide.

You could see the error because in the debug output it said
image

Oh ok i see… thanks for your kindness

1 Like