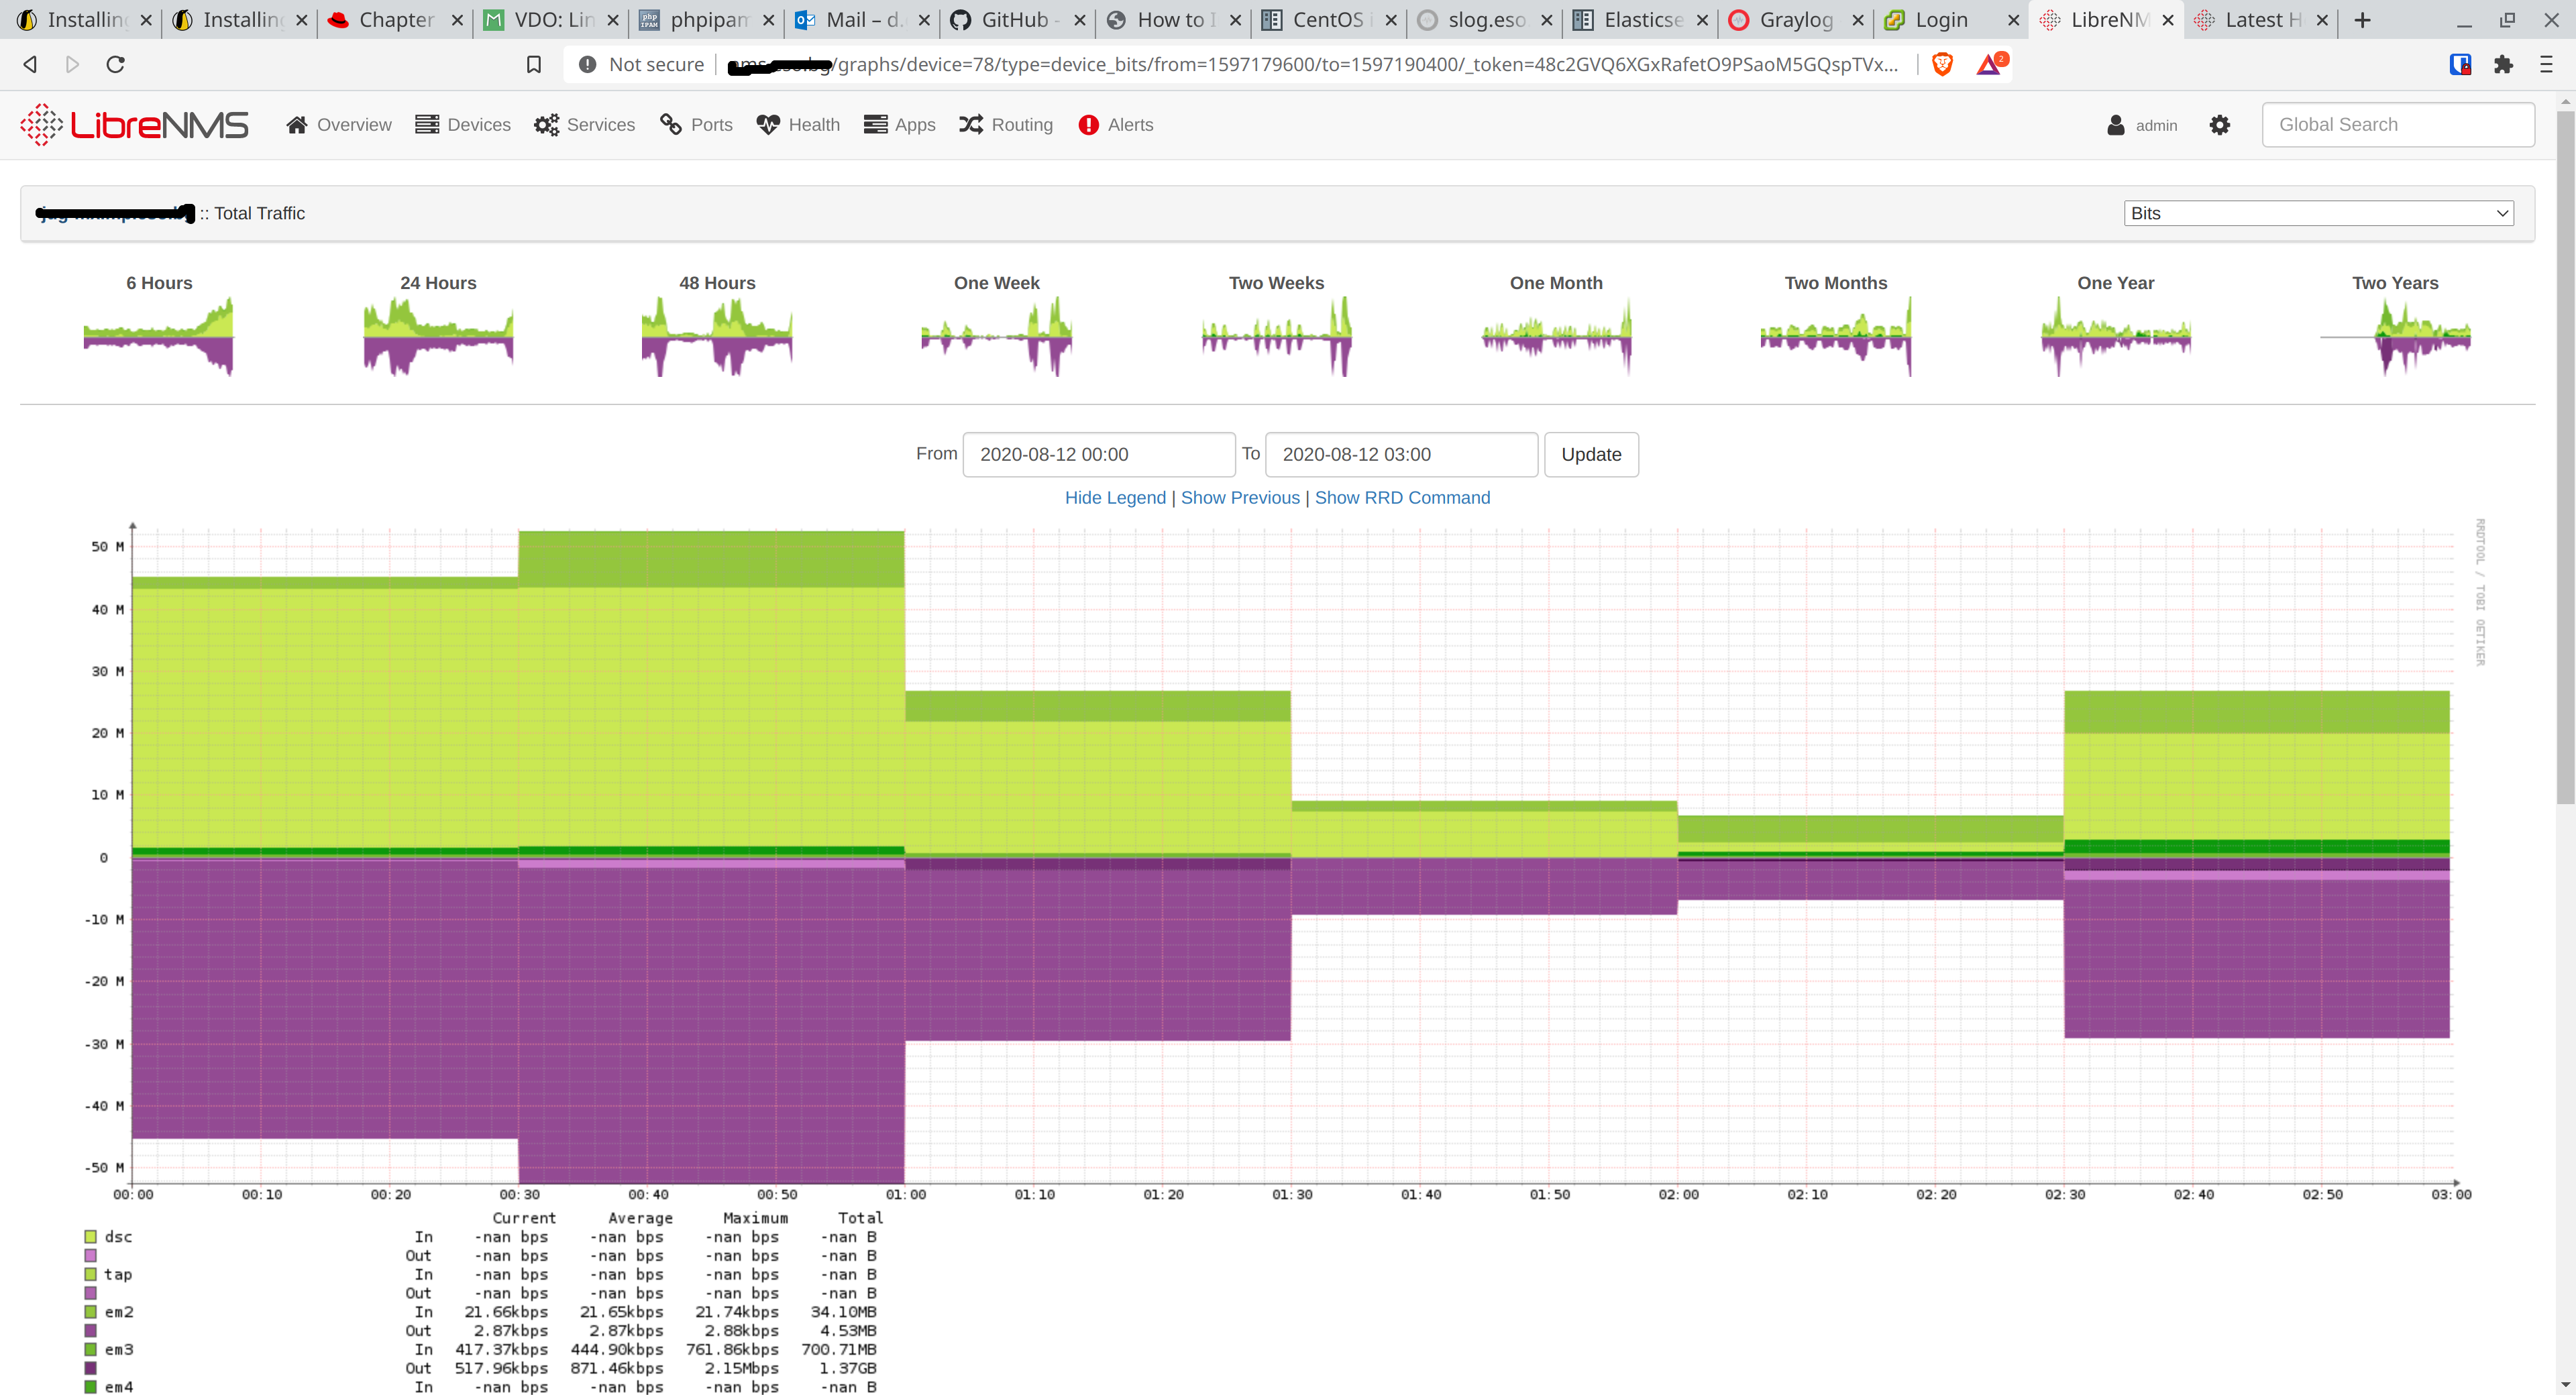
Hi all. When I want to see graph for past period, the graph (values) are rounded in 30 min time slices, as you can see in attached file. Can i see that graph (values) in 5 min time slices, for example like graph for last hour ? Thank You in advance!