Bandwidth graphing is working for the days and weeks but the month graph isn’t showing up correctly. Can I set a maximum bandwidth range on a per port basis. This port can only do 1 gig but the graph is showing all the way up to 12 gig.
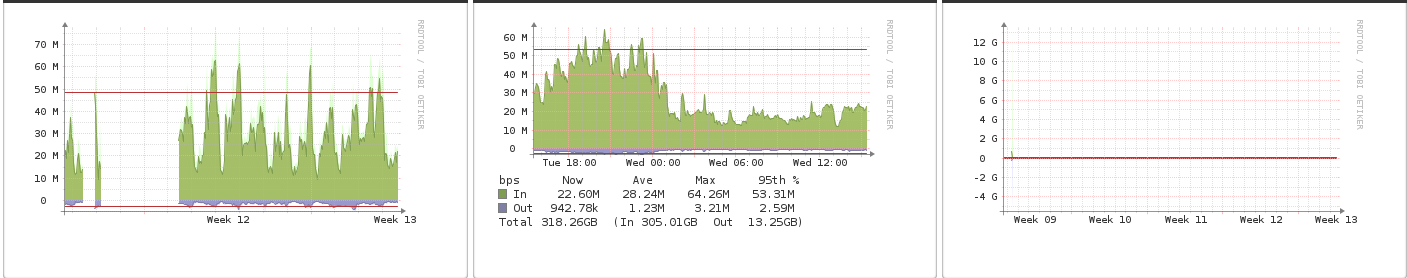
Yes, you have a spike in your month graph making your normal traffic look like nothing.
The remove spikes script might be of use.
awesome, thank you for the replies!. One other thing i’ve noticed with the monthly view is the current bandwidth usage doesn’t match the 24 hour view. There is about a 70 meg difference between the two.