Hello all,
I’m having an issue with LibreNMS polling a IRB on a Juniper QFX5100. Other ports on the device are polling fine, it is just this one port that is not and ironically its the port we need polled more than any of the others.
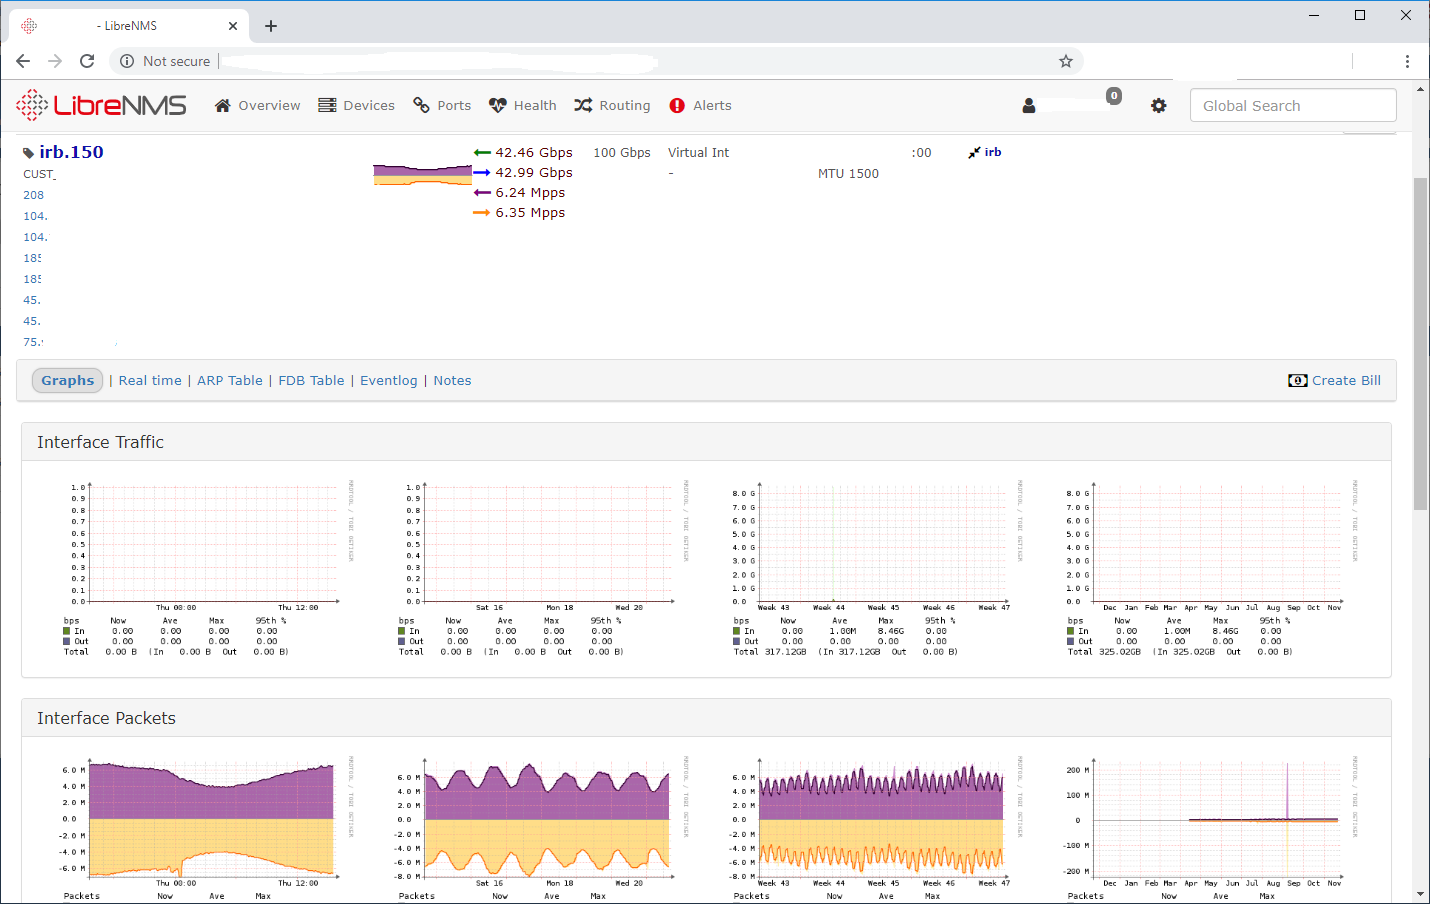
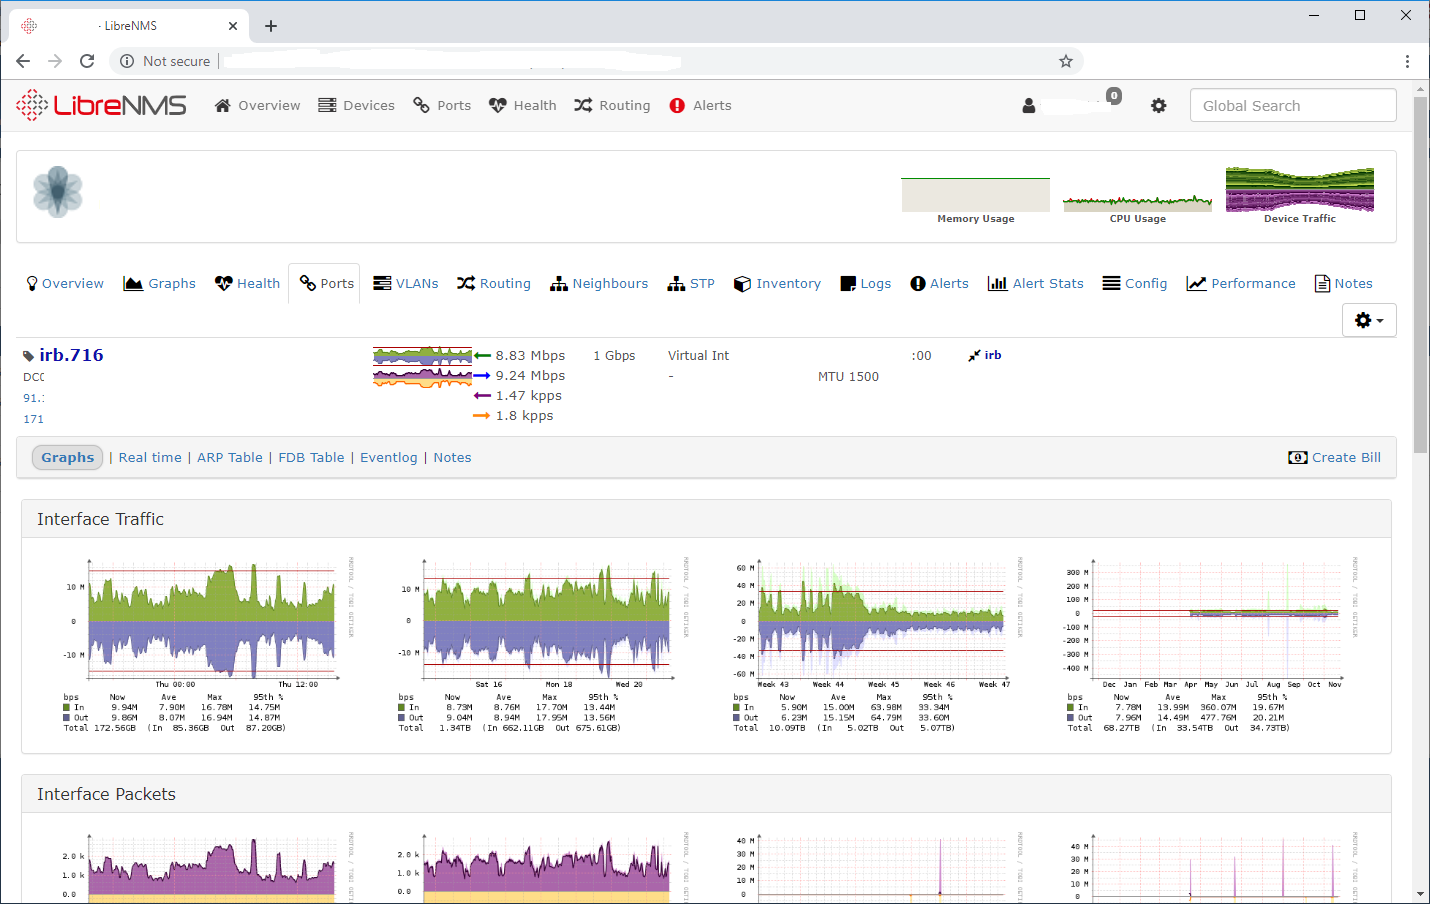
When I navigate to it in in the WebGUI url.com/device/device=20/tab=port/port=14367/ It shows me the current traffic but when you look down at the Interface Traffic graphs they all say 0.00 yet Interface packets has graphs!
Someone please help me find this gremlin in this port.
Validate.php:
Last login: Mon Nov 18 10:00:20 EST 2019 on pts/0
-bash-4.2$ ./validate.php
====================================
| Component | Version |
|---|---|
| LibreNMS | 1.57-70-gbf181b9 |
| DB Schema | 2019_04_22_220000_update_route_table (147) |
| PHP | 7.1.21 |
| MySQL | 5.5.56-MariaDB |
| RRDTool | 1.4.8 |
| SNMP | NET-SNMP 5.7.2 |
====================================
[OK] Composer Version: 1.9.1
[OK] Dependencies up-to-date.
[OK] Database connection successful
[OK] Database schema correct
[FAIL] The poller (netmon) has not completed within the last 5 minutes, check the cron job.
[FAIL] The poller (netmon.*********.com) has not completed within the last 5 minutes, check the cron job.
-bash-4.2$
I see that says its not completed but its polled theres 1,000s of monitors updated all the time in the webgui.
Thank you,
Tom