Hi Guys,
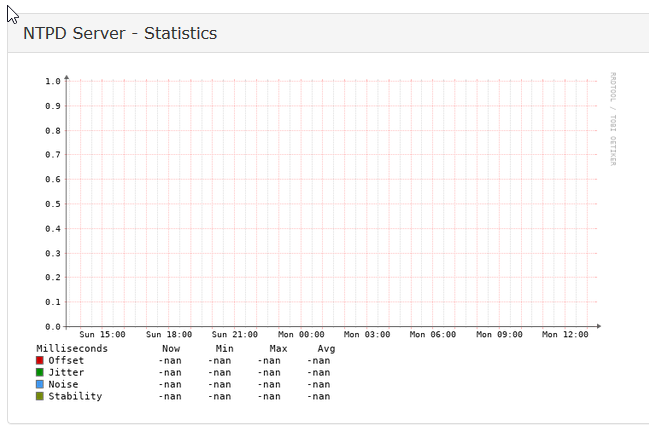
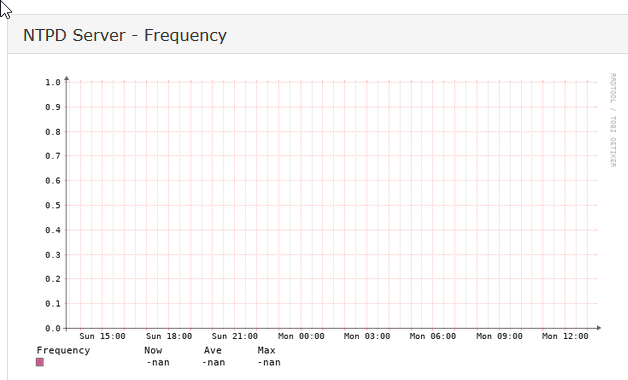
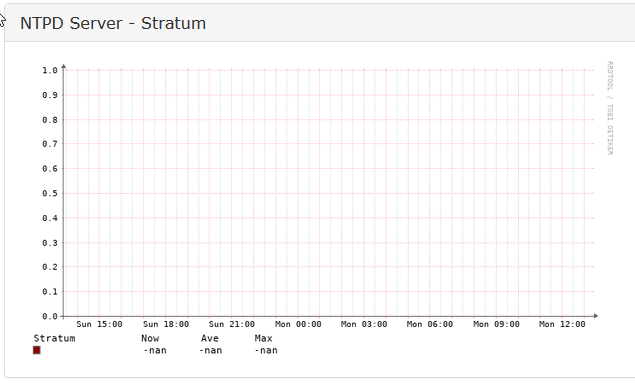
I’m trying to graph ntp-server application from our NTP servers. The graphs are returning -NAN values.
I have followed the document below and added the snmp extend in both target hosts:
I have enabled application, services, and ntp modules in config.php:
Enable additiona poller modules
$config[‘poller_modules’][‘applications’] = true;
$config[‘poller_modules’][‘ntp’] = true;
$config[‘poller_modules’][‘services’] = true;
I have enabled NTP-server module in both hosts in the WEB-GUI
Running Discovery:
./discovery.php -h MYHOST | grep ntp
MYHOST 140 linux
Load disco module ntp
Runtime for discovery module ‘ntp’: 0.0000 seconds with 232 bytes
Unload disco module ntp
Running poller:
./poller.php -h MYHOST | grep ntp
Hostname: MYHOST
ntp-server: …
Load poller module ntp
Runtime for poller module ‘ntp’: 0.0002 seconds with 320 bytes
Unload poller module ntp
Running validate:
./validate.php
| Component | Version |
|---|---|
| LibreNMS | 1.54 |
| DB Schema | 2019_07_03_132417_create_mpls_saps_table (139) |
| PHP | 7.2.19-0ubuntu0.18.04.1 |
| MySQL | 10.1.40-MariaDB-0ubuntu0.18.04.1 |
| RRDTool | 1.7.0 |
| SNMP | NET-SNMP 5.7.3 |
| ==================================== |
[OK] Composer Version: 1.9.0
[OK] Dependencies up-to-date.
[OK] Database connection successful
[OK] Database schema correct


Any advice on this please ?
Thanks