$ ./validate.php
| Component | Version |
|---|---|
| LibreNMS | 21.5.1-40-g53ce0e016 |
| DB Schema | 2021_25_01_0127_create_isis_adjacencies_table (210) |
| PHP | 8.0.7 |
| Python | 3.8.5 |
| MySQL | 10.5.10-MariaDB-1:10.5.10+maria~focal |
| RRDTool | 1.7.2 |
| SNMP | NET-SNMP 5.8 |
| ==================================== |
[OK] Composer Version: 2.1.3
[OK] Dependencies up-to-date.
[OK] Database connection successful
[OK] Database schema correct
$ $
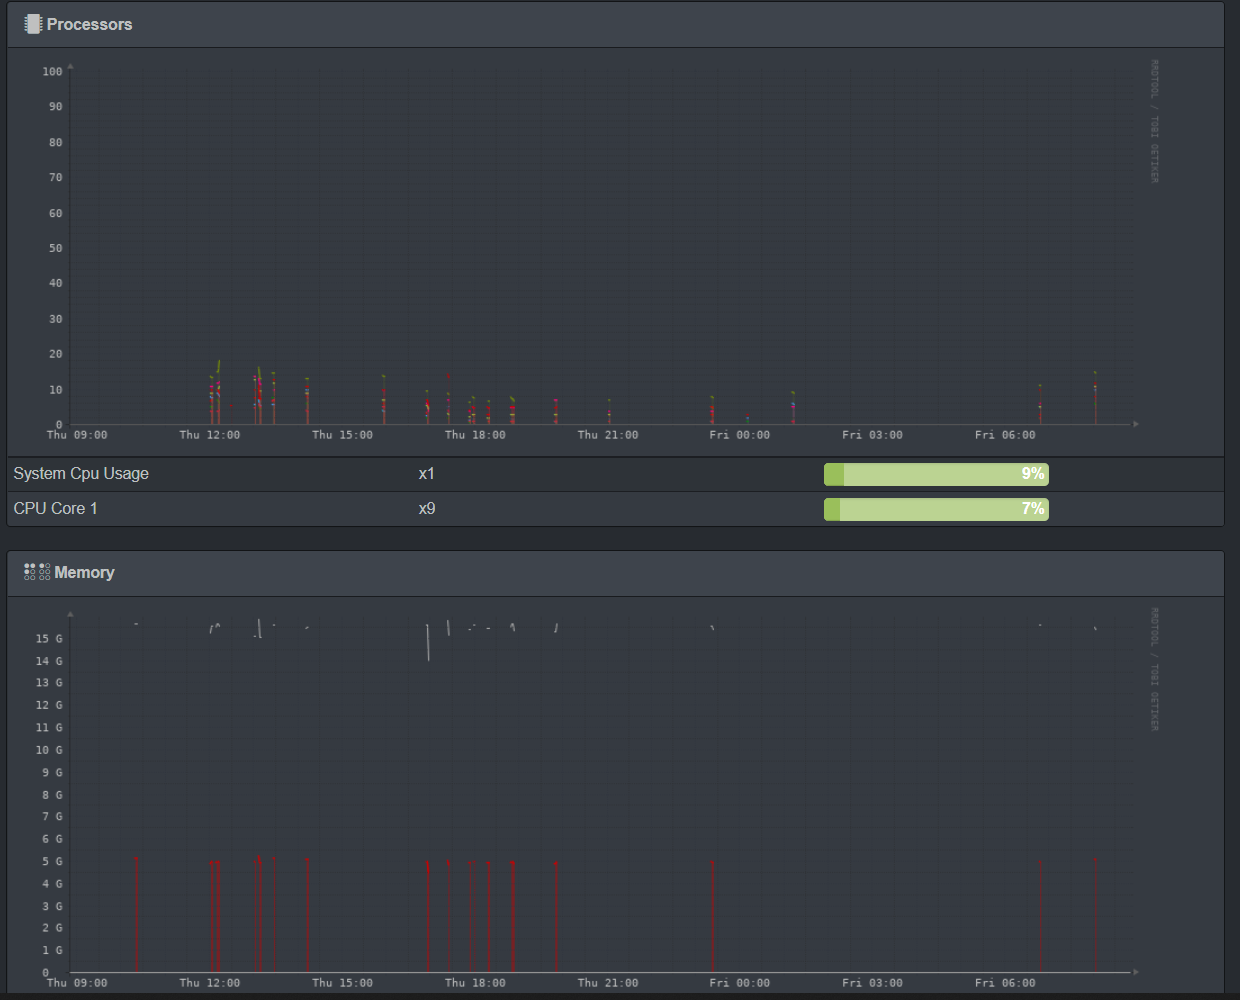
I can see files being created and updated in /opt/librenms/rrd. I just don’t see any graphs being filled with data. Not even on the local host (10.31.6.5) graphs.
$ ./discovery.php -h localhost -d | ./pbin.sh
https://p.libren.ms/view/beafa98d
./poller.php -h localhost -r -f -d | ./pbin.sh (show up empty!)
$ ./poller.php -h localhost (runs just fine)
LibreNMS Poller
Starting polling run:
Hostname: localhost
Device ID: 390
OS: linux
Resolved IP: 10.253.198.38
(unix)
Load poller module core
Uptime: 21 hours 6 minutes 7 seconds
Runtime for poller module ‘core’: 0.1205 seconds with 161576 bytes
SNMP: [2/0.03s] MySQL: [0/0.00s] InfluxDB: [1/0.09s] RRD: [1/0.00s]
Unload poller module core
Load poller module availability
Availability:
1 day : 100%
7 days : 100%
30 days : 100%
365 days : 100%
Runtime for poller module ‘availability’: 1.3722 seconds with 38784 bytes
SNMP: [0/0.00s] MySQL: [5/0.01s] InfluxDB: [5/1.50s] RRD: [5/0.00s]
Unload poller module availability
Module [ unix-agent ] disabled globally.
Load poller module os
Generic ![]()
Location: Rack, Room, Building, City, Country [GPSX,Y]
Hardware: Generic x86 64-bit
OS Version: 5.4.0-74-generic
OS Features: Ubuntu 20.04
Serial:
Runtime for poller module ‘os’: 0.0024 seconds with 94208 bytes
SNMP: [0/0.00s] MySQL: [0/0.00s] InfluxDB: [1/0.36s] RRD: [1/0.00s]
Unload poller module os
Load poller module ipmi
Runtime for poller module ‘ipmi’: 0.0012 seconds with 2912 bytes
SNMP: [0/0.00s] MySQL: [1/0.00s] InfluxDB: [1/0.43s] RRD: [1/0.00s]
Unload poller module ipmi
Load poller module sensors
Runtime for poller module ‘sensors’: 0.0011 seconds with 1504 bytes
SNMP: [0/0.00s] MySQL: [1/0.00s] InfluxDB: [1/0.30s] RRD: [1/0.00s]
Unload poller module sensors
Load poller module processors
Intel Xeon E5-2690 0 @ 2.90GHz: 84%
Intel Xeon E5-2690 0 @ 2.90GHz: 99%
Intel Xeon E5-2690 0 @ 2.90GHz: 73%
Intel Xeon E5-2690 0 @ 2.90GHz: 71%
Runtime for poller module ‘processors’: 0.6223 seconds with 62000 bytes
SNMP: [1/0.01s] MySQL: [5/0.00s] InfluxDB: [5/0.74s] RRD: [5/0.00s]
Unload poller module processors
Load poller module mempools
hrstorage [system]: Physical memory: 18% 5.57 GiiB / 31.36 GiiB
hrstorage [virtual]: Virtual memory: 96% 31.11 GiiB / 32.32 GiiB
hrstorage [buffers]: Memory buffers: 1% 440.39 MiiB / 31.36 GiiB
hrstorage [cached]: Cached memory: 80% 25.11 GiiB / 31.36 GiiB
hrstorage [shared]: Shared memory: 0% 21.67 MiiB / 31.36 GiiB
hrstorage [swap]: Swap space: 0% 3.01 MiiB / 976 MiiB
Runtime for poller module ‘mempools’: 5.3190 seconds with 111216 bytes
SNMP: [1/0.01s] MySQL: [0/0.00s] InfluxDB: [7/7.68s] RRD: [7/0.00s]
Unload poller module mempools
Load poller module storage
Storage /run: hrstorage
0%
Storage /: hrstorage
34%
Storage /dev/shm: hrstorage
0%
Storage /run/lock: hrstorage
0%
Storage /sys/fs/cgroup: hrstorage
0%
Storage /run/snapd/ns: hrstorage
0%
Storage /run/user/999: hrstorage
0%
Storage /run/user/1000: hrstorage
0%
Runtime for poller module ‘storage’: 2.7182 seconds with 18000 bytes
SNMP: [1/0.02s] MySQL: [9/0.02s] InfluxDB: [9/3.01s] RRD: [9/0.00s]
Unload poller module storage
Load poller module netstats
ICMP IP IP-FORWARD SNMP TCP TCPHC UDP
Runtime for poller module ‘netstats’: 1.2014 seconds with 2928 bytes
SNMP: [7/0.18s] MySQL: [0/0.00s] InfluxDB: [6/1.39s] RRD: [6/0.00s]
Unload poller module netstats
Load poller module hr-mib
Processes Users
Runtime for poller module ‘hr-mib’: 0.8299 seconds with 3168 bytes
SNMP: [1/0.02s] MySQL: [0/0.00s] InfluxDB: [3/0.92s] RRD: [3/0.00s]
Unload poller module hr-mib
Load poller module ucd-mib
Runtime for poller module ‘ucd-mib’: 12.9061 seconds with 4920 bytes
SNMP: [2/0.04s] MySQL: [0/0.00s] InfluxDB: [19/12.95s] RRD: [19/0.01s]
Unload poller module ucd-mib
Load poller module ipSystemStats
ipv4 ipv6
Runtime for poller module ‘ipSystemStats’: 1.2250 seconds with 17048 bytes
SNMP: [1/0.02s] MySQL: [0/0.00s] InfluxDB: [3/1.72s] RRD: [3/0.00s]
Unload poller module ipSystemStats
Load poller module ports
Caching Oids: Full ports polling ifDescr ifAdminStatus ifOperStatus ifLastChange ifType ifPhysAddress ifMtu ifInErrors ifOutErrors ifInDiscards ifOutDiscards dot3StatsDuplexStatus
Port lo: lo (1 / #261372) VLAN = lobps(527.74 Kbps/527.74 Kbps)bytes(14.09 MiB/14.09 MiB)pkts(330.59 pps/330.59 pps)
Port eth0: Intel Corporation 82545EM Gigabit Ethernet Controller (Copper) (2 / #261373) dot3Duplex VLAN = Intel Corporation 82545EM Gigabit Ethernet Controller (Copper)bps(353.69 Kbps/154.54 Kbps)bytes(9.44 MiB/4.13 MiB)pkts(200.99 pps/193.39 pps)
Runtime for poller module ‘ports’: 0.8115 seconds with 39904 bytes
SNMP: [14/0.20s] MySQL: [5/0.00s] InfluxDB: [3/0.82s] RRD: [3/0.00s]
Unload poller module ports
Load poller module customoid
Runtime for poller module ‘customoid’: 0.0010 seconds with 2368 bytes
SNMP: [0/0.00s] MySQL: [1/0.00s] InfluxDB: [1/0.16s] RRD: [1/0.00s]
Unload poller module customoid
Module [ bgp-peers ] disabled on os.
Module [ junose-atm-vp ] disabled globally.
Module [ printer-supplies ] disabled globally.
Load poller module ucd-diskio
Runtime for poller module ‘ucd-diskio’: 0.0012 seconds with 1864 bytes
SNMP: [0/0.00s] MySQL: [1/0.00s] InfluxDB: [1/0.22s] RRD: [1/0.00s]
Unload poller module ucd-diskio
Load poller module wifi
Runtime for poller module ‘wifi’: 0.0001 seconds with 512 bytes
SNMP: [0/0.00s] MySQL: [0/0.00s] InfluxDB: [1/0.11s] RRD: [1/0.00s]
Unload poller module wifi
Load poller module wireless
Runtime for poller module ‘wireless’: 0.0023 seconds with 104592 bytes
SNMP: [0/0.00s] MySQL: [1/0.00s] InfluxDB: [1/0.07s] RRD: [1/0.00s]
Unload poller module wireless
Module [ ospf ] disabled on os.
Module [ isis ] disabled globally.
Module [ cisco-ipsec-flow-monitor ] disabled globally.
Module [ cisco-remote-access-monitor ] disabled globally.
Module [ cisco-cef ] disabled globally.
Module [ slas ] disabled globally.
Module [ cisco-mac-accounting ] disabled globally.
Module [ cipsec-tunnels ] disabled globally.
Module [ cisco-ace-loadbalancer ] disabled globally.
Module [ cisco-ace-serverfarms ] disabled globally.
Module [ cisco-asa-firewall ] disabled globally.
Module [ cisco-voice ] disabled globally.
Module [ cisco-cbqos ] disabled globally.
Module [ cisco-otv ] disabled globally.
Module [ cisco-qfp ] disabled globally.
Module [ cisco-vpdn ] disabled globally.
Module [ nac ] disabled globally.
Load poller module netscaler-vsvr
Runtime for poller module ‘netscaler-vsvr’: 0.0003 seconds with 1672 bytes
SNMP: [0/0.00s] MySQL: [0/0.00s] InfluxDB: [1/0.06s] RRD: [1/0.00s]
Unload poller module netscaler-vsvr
Module [ aruba-controller ] disabled globally.
Load poller module entity-physical
Runtime for poller module ‘entity-physical’: 0.0011 seconds with 1976 bytes
SNMP: [0/0.00s] MySQL: [1/0.00s] InfluxDB: [1/0.25s] RRD: [1/0.00s]
Unload poller module entity-physical
Module [ entity-state ] disabled globally.
Load poller module applications
Runtime for poller module ‘applications’: 0.0009 seconds with 1512 bytes
SNMP: [0/0.00s] MySQL: [1/0.00s] InfluxDB: [1/0.20s] RRD: [1/0.00s]
Unload poller module applications
Module [ mib ] disabled globally.
Module [ stp ] disabled on os.
Load poller module ntp
Runtime for poller module ‘ntp’: 0.0001 seconds with 320 bytes
SNMP: [0/0.00s] MySQL: [0/0.00s] InfluxDB: [1/0.42s] RRD: [1/0.00s]
Unload poller module ntp
Load poller module loadbalancers
Runtime for poller module ‘loadbalancers’: 0.0001 seconds with 240 bytes
SNMP: [0/0.00s] MySQL: [0/0.00s] InfluxDB: [1/0.35s] RRD: [1/0.00s]
Unload poller module loadbalancers
Module [ mef ] disabled globally.
Load poller module mpls
Runtime for poller module ‘mpls’: 0.0006 seconds with 23960 bytes
SNMP: [0/0.00s] MySQL: [0/0.00s] InfluxDB: [1/0.07s] RRD: [1/0.00s]
Unload poller module mpls
Enabling graphs:
Polled in 35.872 seconds
Start Device Groups
End Device Groups, runtime: 0.0287s
Start Alerts
Rule #2 (SNMP not responding on Device - Check on SNMP Service - Device marked Down!): Status: NOCHG
Rule #3 (Device rebooted): Status: NOCHG
Rule #5 (BGP Session established): Status: NOCHG
Rule #8 (Port utilisation over threshold): Status: NOCHG
Rule #9 (Sensor over limit - Check Device Health Settings): Status: NOCHG
Rule #10 (Sensor under limit - Check Device Health Settings): Status: NOCHG
Rule #11 (Service up/down): Status: NOCHG
Rule #12 (Wireless Sensor over limit): Status: NOCHG
Rule #13 (Wireless Sensor under limit): Status: NOCHG
Rule #15 (CustomOID over limit): Status: NOCHG
Rule #16 (CustomOID under limit): Status: NOCHG
Rule #17 (CustomOID over warning limit): Status: NOCHG
Rule #18 (CustomOID under warning limit): Status: NOCHG
End Alerts
SNMP [31/0.53s]: Get[8/0.11s] Getnext[4/0.07s] Walk[19/0.36s]
MySQL [49/0.25s]: Cell[14/0.01s] Row[-14/-0.01s] Rows[25/0.21s] Column[1/0.00s] Update[22/0.04s] Insert[1/0.00s] Delete[0/0.00s]
InfluxDB [77/35.34s]: Write[77/35.34s]
RRD [77/0.02s]: Update[77/0.02s]
I read an post where they said it can be an issue with the database, you can repair it by mysql -u librenms -p librenms < sql-schema/167.sql. But then i get the error: ERROR 1054 (42S22) at line 1: Unknown column ‘config_default’ in ‘field list’
Any help would be appreciated!