Hello,
We have approximately 42 Cisco Nexus 9000 switches (N9K-C93180YC-FX), but only one of them is experiencing issues with the graphs. There are some spikes with unrealistic value.
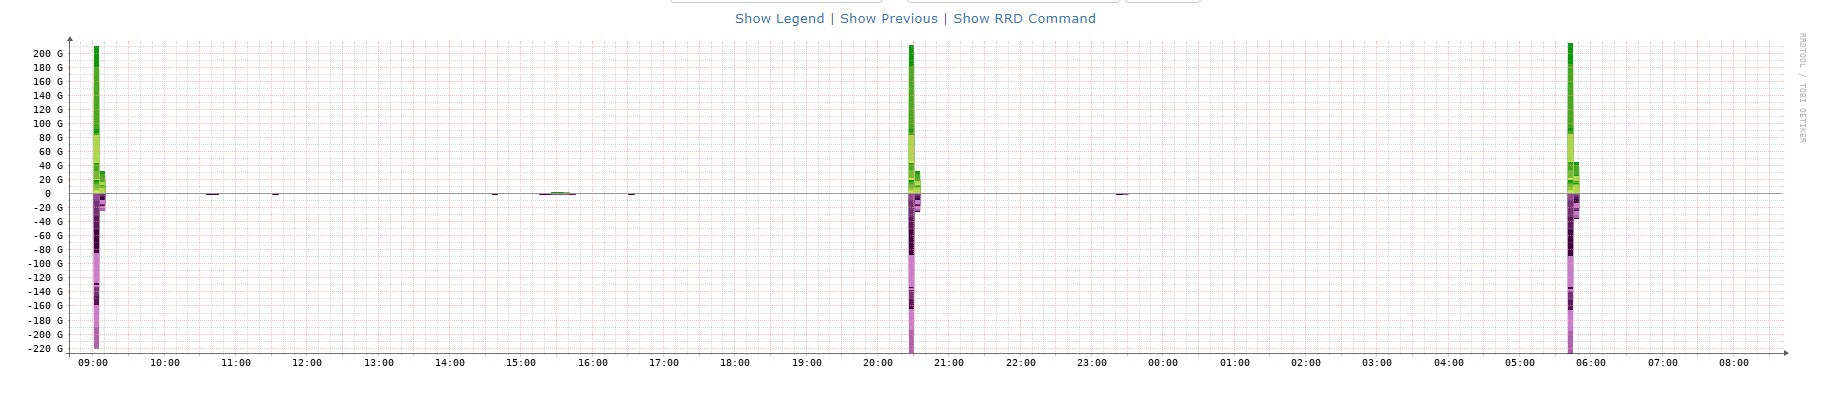
This happens on several ports, not just on the Overall Traffic.
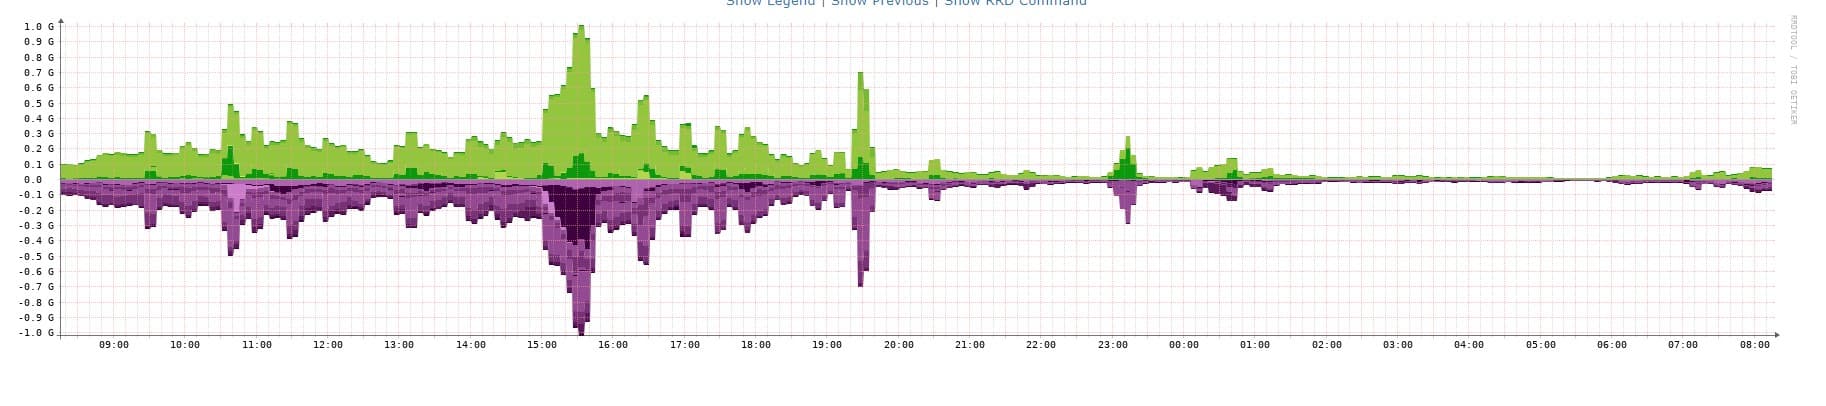
It’s interesting that this switch is in a vPC with another one, and this one doesn’t have the same graph issues
Does anyone know how to fix this?
Thanks!
$ ./validate.php
| Component | Version |
|---|---|
| LibreNMS | 23.10.0-61-g7c006e962 (2023-11-07T19:25:28-03:00) |
| DB Schema | 2023_11_04_125846_packages_increase_name_column_length (273) |
| PHP | 8.1.24 |
| Python | 3.6.8 |
| Database | MariaDB 10.3.39-MariaDB |
| RRDTool | 1.7.0 |
| SNMP | 5.8 |
| =========================================== |
[OK] Composer Version: 2.6.5
[OK] Dependencies up-to-date.
[OK] Database connection successful
[OK] Database Schema is current
[OK] SQL Server meets minimum requirements
[OK] lower_case_table_names is enabled
[OK] MySQL engine is optimal
[OK] Database and column collations are correct
[OK] Database schema correct
[OK] MySQl and PHP time match
[OK] Distributed Polling setting is enabled globally
[OK] Connected to rrdcached
[OK] Active pollers found
[OK] Dispatcher Service is enabled
[OK] Locks are functional
[OK] Python wrapper cron entry is not present
[OK] Redis is functional
[OK] rrdtool version ok
[OK] Connected to rrdcached