I’ve ran the script now,
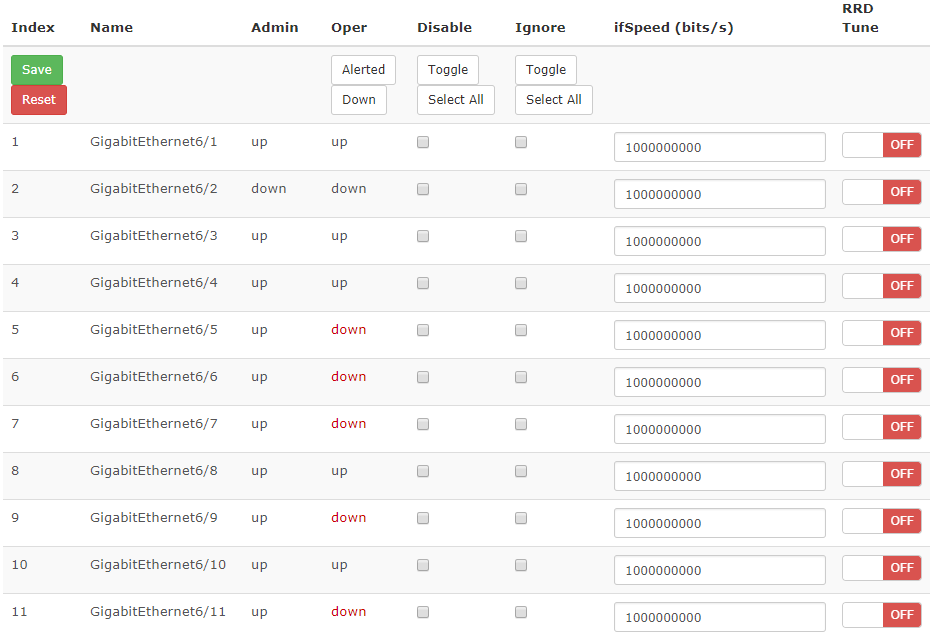
/opt/librenms/scripts# php tune_port.php -h 10.9.12.1
Found hostname 10.9.12.1…
Tuning port Gi6/1…
Tuning port Gi6/2…
Tuning port Gi6/3…
Tuning port Gi6/4…
Tuning port Gi6/5…
Tuning port Gi6/6…
Tuning port Gi6/7…
Tuning port Gi6/8…
Tuning port Gi6/9…
Tuning port Gi6/10…
Tuning port Gi6/11…
Tuning port Gi6/12…
Tuning port Gi6/13…
Tuning port Gi6/14…
Tuning port Gi6/15…
Tuning port Gi6/16…
Tuning port Gi6/17…
Tuning port Gi6/18…
Tuning port Gi6/19…
Tuning port Gi6/20…
Tuning port Gi6/21…
Tuning port Gi6/22…
Tuning port Gi6/23…
Tuning port Gi6/24…
Tuning port Gi7/1…
Tuning port Gi7/2…
Tuning port Gi8/1…
Tuning port Gi8/2…
Tuning port Gi12/1…
etc…
Nothing has changed yet - I guess I need to wait 24 hours for the graph to redraw?
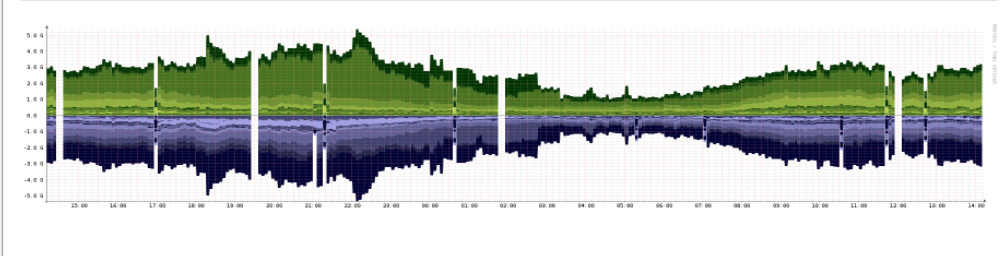
Hi again just a quick update, we increased the CPU cores to 16 on this VM and now the gaps slightly less now, we will re-set this up on a standalone server with a better CPU so hopefully that will help.
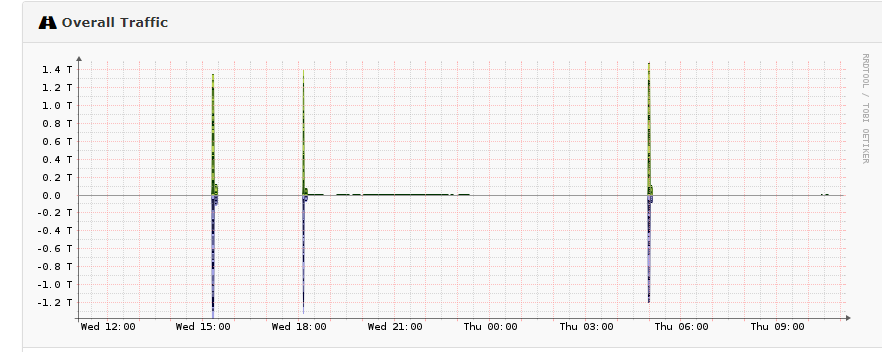
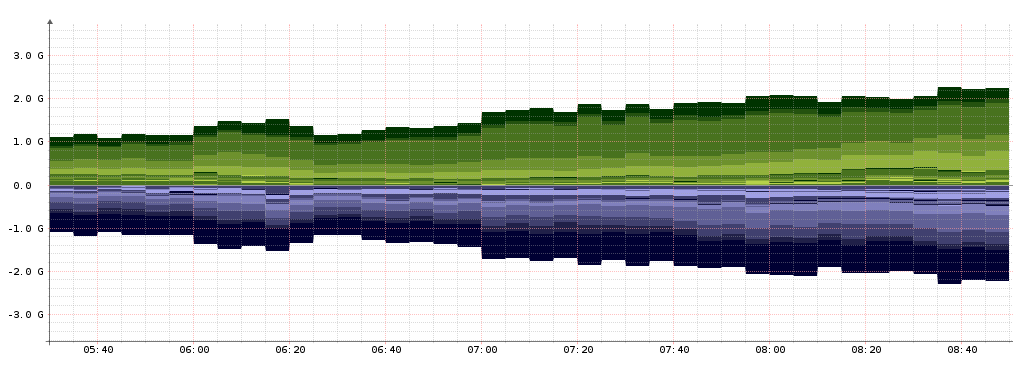
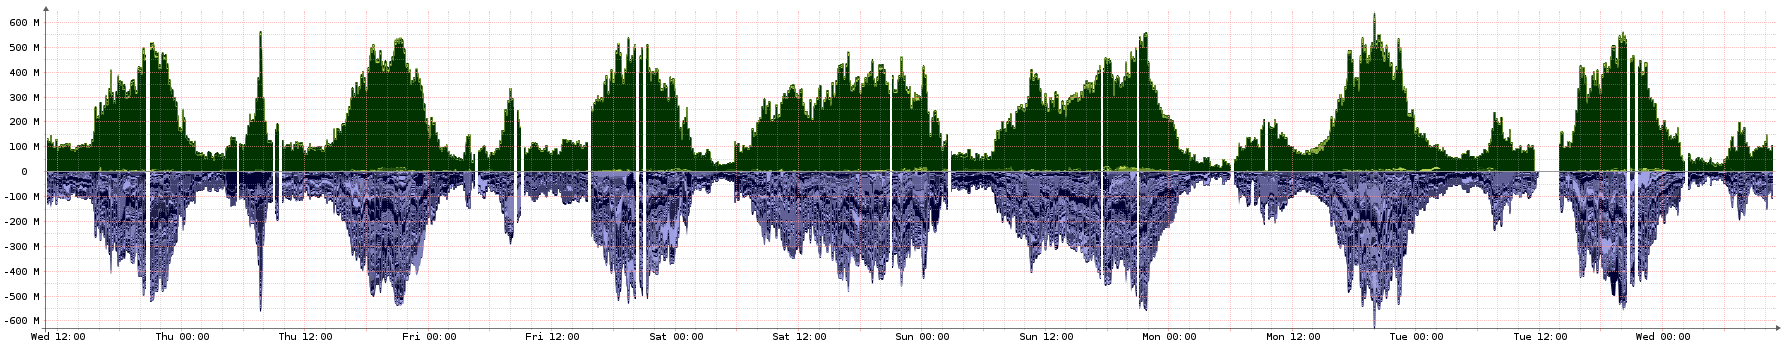
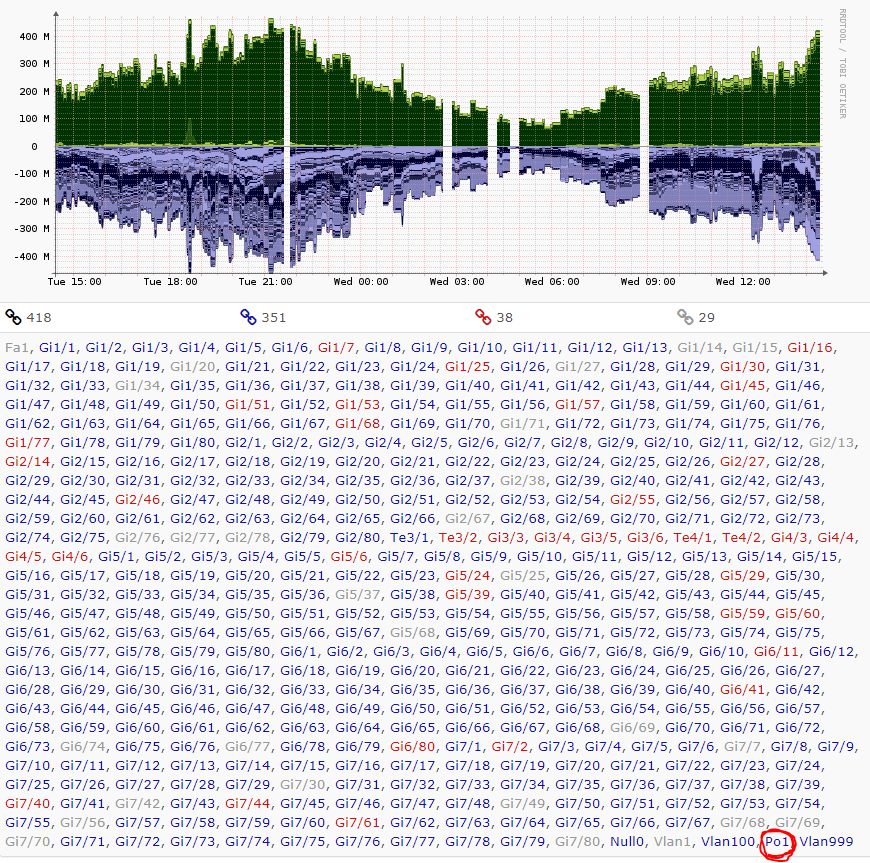
Though we have a slight issue with the Overall graphs still, some reason the download and upload drawings are identical and this is certainly not the case.
5 minutes polling - RRD tuner is turned on - Just strange the overall graphs seem to be symmetrical.
I’m just thinking, does the Overall Traffic include the port channel interface (Po1) as well as the associated physical interfaces within this port channel?
Overall traffic can be little misleading, Allot my graphs look like that too. But if you go Ports and look at all the Ports you see what each port is reporting back in the data flow. The overall graph pulls all that into one big graph.