Help with performance tuning

I’m new to LibreNMS and I am not a Linux expert by any means. I’ve got LibreNMS up and working, but I think I need to dial in the performance. I’m running on Ubuntu with Apache. I’m getting a lot of gaps in my graphs and I haven’t even set that many up yet. I’ve read through the docs, but I think a lot of stuff there assumes a level of knowledge of Linux that I just don’t have. So, I’m hoping someone can give me some help. Explain it to me like I’m 5. And a Windows user.

This is the document I’m using: Performance - LibreNMS Docs

RRDcached

Since version 1.5, rrdtool / rrdcached now supports creating rrd files over rrdcached. If you have rrdcached 1.5.5 or above, you can also tune over rrdcached. To enable this set the following config:

$config['rrdtool_version'] = '1.5.5';

NOTE: This feature requires your client version of rrdtool to be 1.5.5 or over, in addition to your rrdcached version.

First, I assume that line should be added to /opt/librenms/config.php. Is that correct?
Second, the version of rrdtool/rrdcached I have installed is 1.7.0-1build1. Do I use 1.5.5 in that line in the config file, or do I use the actual version I have? In my instance should it be “$config[‘rrdtool_version’] = ‘1.7.0’;” or “$config[‘rrdtool_version’] = ‘1.5.5’;”?

MySQL Optimisation

It’s advisable after 24 hours of running MySQL that you run MySQL Tuner which will make suggestions on things you can change specific to your setup.

One recommendation we can make is that you set the following in my.cnf under a [mysqld] group:

innodb_flush_log_at_trx_commit = 0

You can also set this to 2. This will have the possibility that you could lose up to 1 second on mysql data in the event MySQL crashes or your server does but it provides an amazing difference in IO use.

And here I am completely lost. How do I run the MySQL Tuner? That link just goes to a page of code. I have no idea what to do that with. Where is the my.cnf file that I should edit with that line? What does a value of 0 or 2 actually do? Why should I choose a setting of 2 over 0, or vice versa?

SNMP Max Repeaters
I don’t understand what I’m trying to accomplish here, what impact this setting has or what the “best setting” is that I’m trying to find. Looking at the polling history, one of my Cisco 6807 switches takes the longest to poll at around 45 seconds. I ran the script three different times, several minutes apart, for values of 10, 25, and 50. These were my results.

		Run #1			|		Run #2			|		Run #3
Repeaters: 10			|						|
    real    0m11.897s	|	real    0m7.210s	|	real    0m12.416s
    user    0m0.046s	|	user    0m0.064s	|	user    0m0.059s
    sys     0m0.068s	|	sys     0m0.042s	|	sys     0m0.047s
						|						|
Repeaters: 25			|						|
    real    0m10.233s	|	real    0m6.145s	|	real    0m22.163s
    user    0m0.041s	|	user    0m0.057s	|	user    0m0.038s
    sys     0m0.035s	|	sys     0m0.028s	|	sys     0m0.040s
						|						|
Repeaters: 50			|						|
    real    0m10.258s	|	real    0m7.283s	|	real    0m8.935s
    user    0m0.047s	|	user    0m0.040s	|	user    0m0.033s
    sys     0m0.054s	|	sys     0m0.043s	|	sys     0m0.054s

That looks pretty much the same to me for each run, but also kind of all over the place between runs. And the raw values themselves don’t mean anything to me. I have no idea what to do with these numbers.

fping tuning
I understand what is going on here, I just want to make sure I’m adding this config to the correct file. I assume /opt/librenms/config.php, but I don’t see those “default” values listed there. Unless they don’t have to be unless you want to change them?

Optimise poller-wrapper

The default 16 threads that poller-wrapper.py runs as isn’t necessarily the optimal number. A general rule of thumb is 2 threads per core but we suggest that you play around with lowering / increasing the number until you get the optimal value

How do I know what the “optimal value” is? My server has 8 cores, so the default of 16 follows the rule of thumb. If I lower/increase that number, what do I need to be looking for to happen or not happen?

I know this is a lot of help to ask for, and I have a lot I still need to learn, so I greatly appreciate any assistance!

Hi,

If you dont mind, how many devices are you monitoring or planing to?

Are you experiencing any poll issues?

Saying that coz most of the steps are for fully deployed LibreNMS. For example, mysql optimizations are not the same for 10 devices than for 1k. Same with poller-wrapper threads.

I’ll try to do my best explaning this to you:

RRDCached

You set up your version. That in particular is for distributed polling and will not have real effect in your installation. Just set your version along the other rrdcached options and go.

MySQL Optimization

That link is a perl script.

Download it. For example:

cd /tmp
wget https://raw.githubusercontent.com/major/MySQLTuner-perl/master/mysqltuner.pl

Make it executable:
chmod +x /tmp/mysqltuner.pl

And then run it:

./mysqltuner.pl

That will ask you few things and then output a set of instructions to optimice your install.

SNMP Max Repeaters

Some devices will work better with a set of repeaters. What you are looking for is lower time, always.
In your example device, 45 seconds is not really a bad poll time unless is a 8 port with no sensors switch :wink:

If you plan to run standard 5min poll time, your goal is to poll all devices in less than 300 seconds.
Take a look to your poller performance in http://yourlibrenms/pollers/tab=performance/

fping

You are correct. Default options are not showed in config.php, there are A LOT of defaults. If you want, they are in includes/defaults.inc.php but DO NOT modify that file never. If you need to overwritte a default, just make it in config.php

Poller-wrapper

As I said with repeaters, what you look for here is to poll all your devices in less than the poll time. If you run 5min, then 300 seconds.

If you plan to move to 1min poll, you will need the overall poll cycle to be < 60s.

1 min poll time is very disk intensive. Take it into account if you move to that.

Hope this help you in your install.

1 Like

Thank you very much! That did indeed answer many questions.

I am currently only monitoring 13 devices. The server itself (which is a VM running on Cisco UCS hardware running VMware), the firewall (ASA software on FRP-4110), two Cisco 6807 core switches (although the SNMP service keeps stopping on one of them which I think is a Cisco IOS bug), then a mix of various 3850s, 3650s, and 2960X stacks.

Eventually I plan to monitor several hundred various switches, routers, etc. I don’t know yet if our Systems guy wants to add any server monitoring to it. For now I just have a sample of the types of devices I’ll be monitoring as I get familiar with the software.

So at this point, what would be causing gaps in my graphs? Is this a poller problem or a device problem or a network problem?

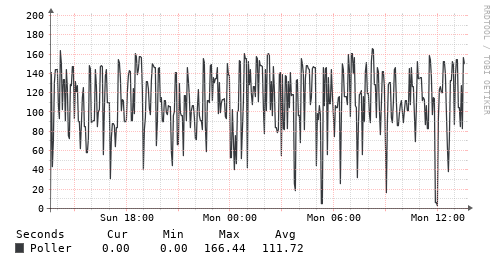
Here’s my last day graph for pollers performance:
image

I can post an example of a graph with gaps that I’m seeing, but it’s only letting me add one image per post and I imagine you know what the gaps in the graph look like.

There are 2 kind of gaps (at least I know of)

The poller ones and the bad snmp implementation ones.

Are the gaps on all devices, graphs? If yes, is a poller gap.

If the gap is in a interface traffic graph and happens on bw > 100Mbit, its a bad snmp implementation from vendor.

A gap from poller only happens if it takes more time than cycle. As for you poller performance graph (which doesnt have gaps), seems to not be that situation.

The gaps do appear on all graphs for all devices except for the host server.

Could be some sort of network issue…

I found the answer to my problem with gaps in all my graphs in this post: Gaps in Data/Gaphs

Particularly this advice:

1 Like

Recently tested the below:

2x Distributed Poller VM Spec:
5 cores per socket
2 sockets
32gb RAM

Am able to poll 878 devices with 50 poller threads (ii.e. poller-wrapper.py 50) in 178 secs. Anything over 50 threads this didn’t yield much difference.