Hi:
Is there any way of adding a graphic of the traffic from just one interface to the dashboard.
I can see the graphic I want by going to the device and selecting the interface. But I would like to have it on the dashboard.
I can only add the one with all the interfaces.
Regards.
Hello Luis_Pablo_Jones,
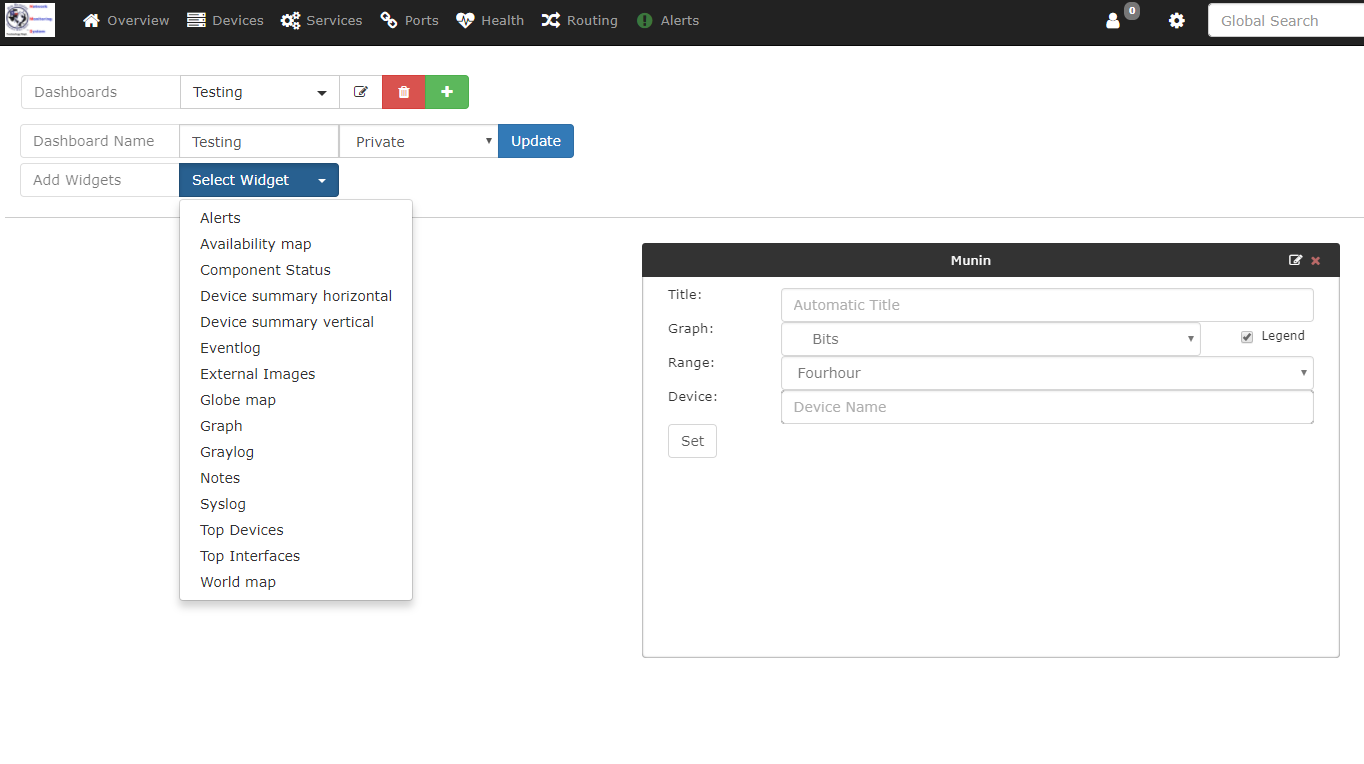
Check under Widget >Graph: You should see lots of options.
Hi Kevin:
I´m not finding that. Where is the Widget menu?
Regards.
ohh I understand.
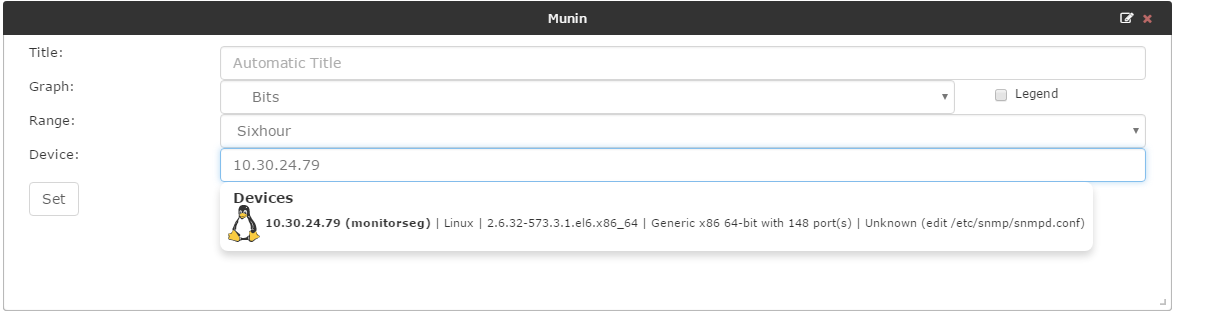
I have done that. The thing is that I select the device and then the graphic shows all the network interfaces on the server.
What I want is only one of the interfaces to be shown. Is that possible?
Regards.
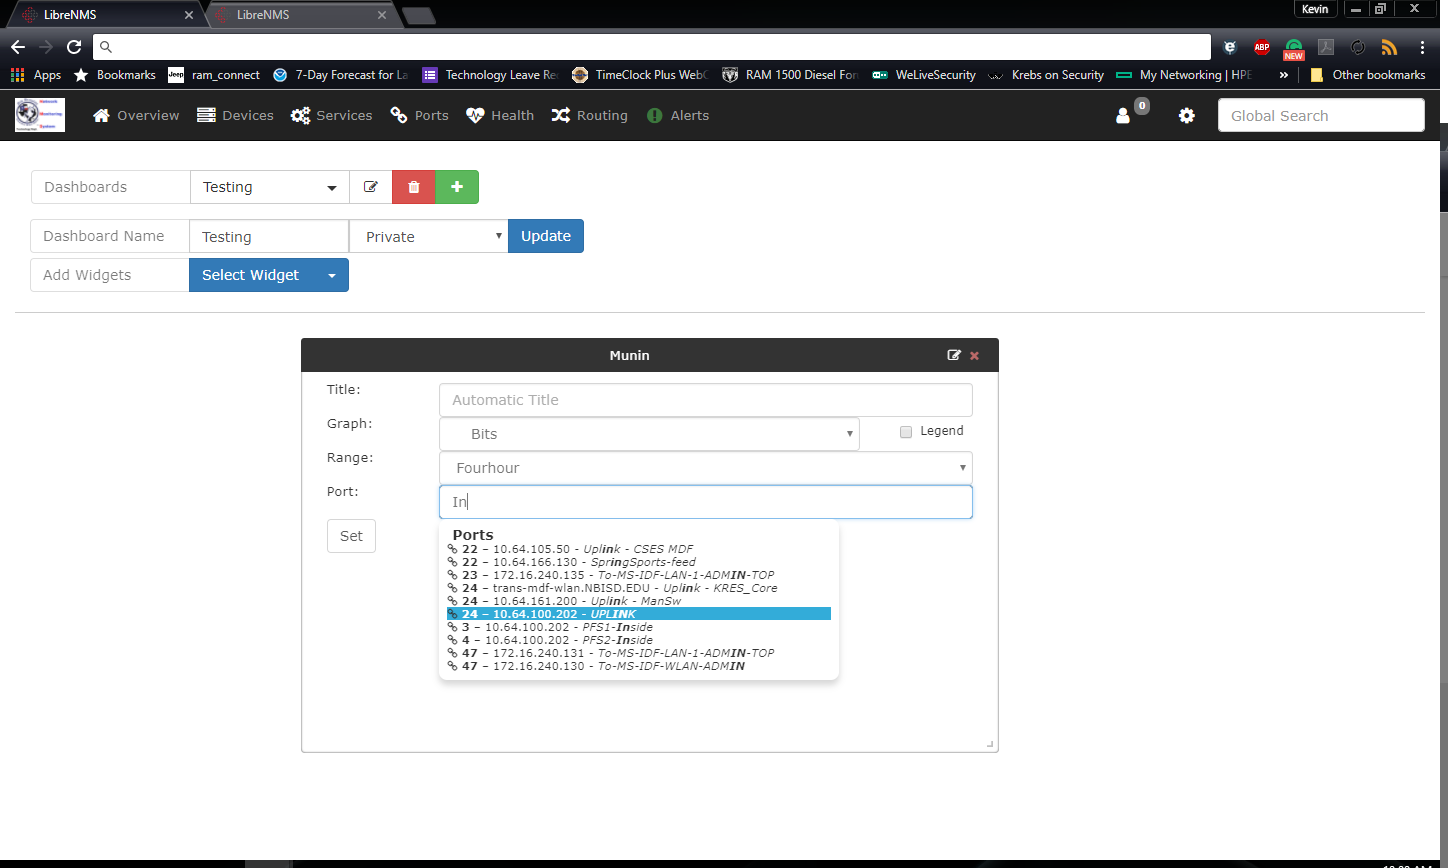
Yes it is possible, Graph Widget> Graph Bits
Then you need to type in the name of the Port you want to graph.
It doestn’t look like that to me.
Instead of Port: It shows Device:
I see… I think you need to find out the name and or id of the port and not the device.
Which Version of librenms do you have?
Have you configured something to get the port on the widget?
Regards.
Version f72e2ce - Tue Jun 13 2017 18:37:21 GMT-0500
I haven’t changed anything. Sorry 
Mine is 5af3048 - Tue May 30 2017 15:44:40 GMT-0300
Maybe I should update to yours.
Regards.
You are using the wrong Bits, it doesn’t show it very well.
You want Port Bits, you have selected Device Bits.
1 Like
You Are right. That was it.
Thank you.