[OK] Composer Version: 2.4.2
[OK] Dependencies up-to-date.
[OK] Database connection successful
[OK] Database Schema is current
[OK] SQL Server meets minimum requirements
[OK] lower_case_table_names is enabled
[OK] MySQL engine is optimal
[OK]
[OK] Database schema correct
[OK] MySQl and PHP time match
[OK] Active pollers found
[OK] Dispatcher Service not detected
[OK] Locks are functional
[OK] Python poller wrapper is polling
[OK] Redis is unavailable
[OK] rrd_dir is writable
[OK] rrdtool version ok
librenms@mgt02:~$
Is this a particular device? All devices? (The poller or discovery, or other) What does the debug output look like for the affected item? Does it appear to hang in a specific module?
[OK] Composer Version: 2.4.2
[OK] Dependencies up-to-date.
[OK] Database connection successful
[OK] Database Schema is current
[OK] SQL Server meets minimum requirements
[OK] lower_case_table_names is enabled
[OK] MySQL engine is optimal
[OK]
[OK] Database schema correct
[OK] MySQl and PHP time match
[OK] Active pollers found
[OK] Dispatcher Service not detected
[OK] Locks are functional
[OK] Python poller wrapper is polling
[OK] Redis is unavailable
[OK] rrd_dir is writable
[OK] rrdtool version ok
[WARN] Your local git contains modified files, this could prevent automatic updates.
[FIX]:
You can fix this with ./scripts/github-remove
Modified Files:
rrd/.gitignore
librenms@mgt02:~$
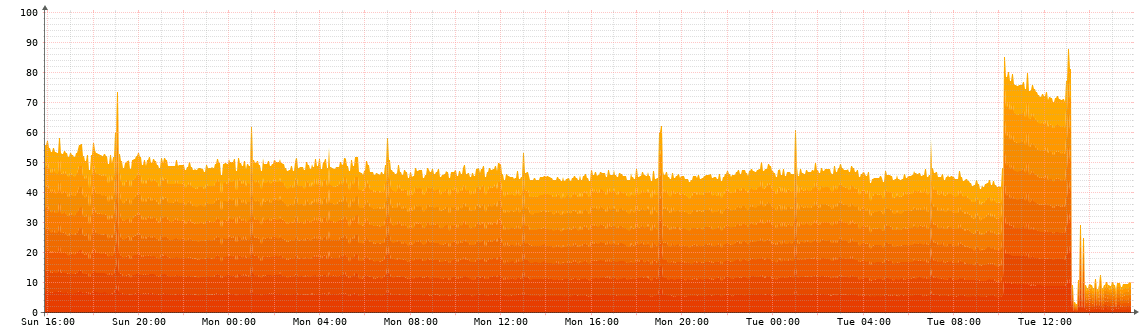
I appear to be getting a similar issue with high cpu since last nights daily script. However I’m on monthly release, still using php 7.4 and Ubuntu 20.04, so not the same. but consist high cpu. No obvious reason as far as i can tell.
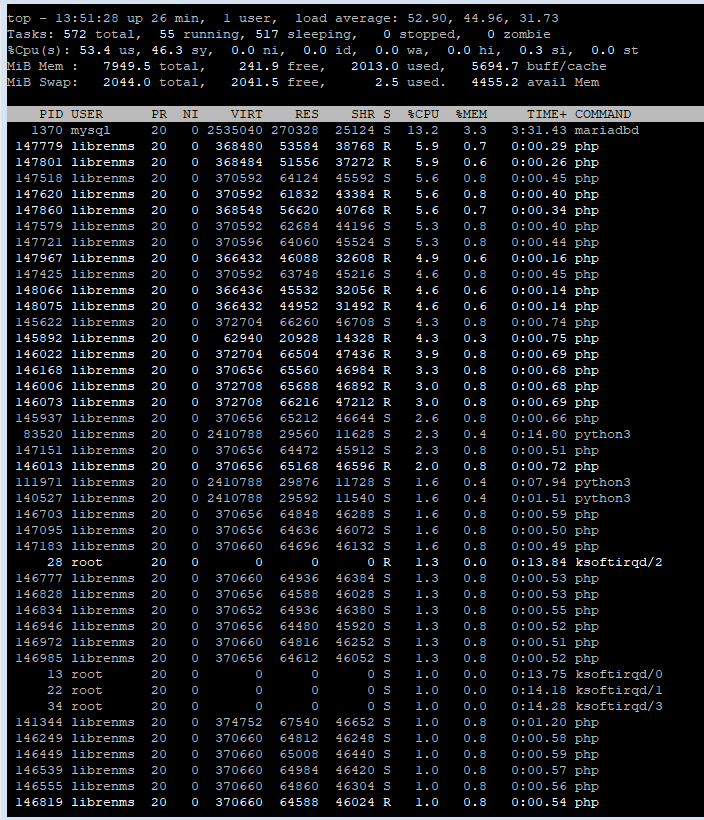
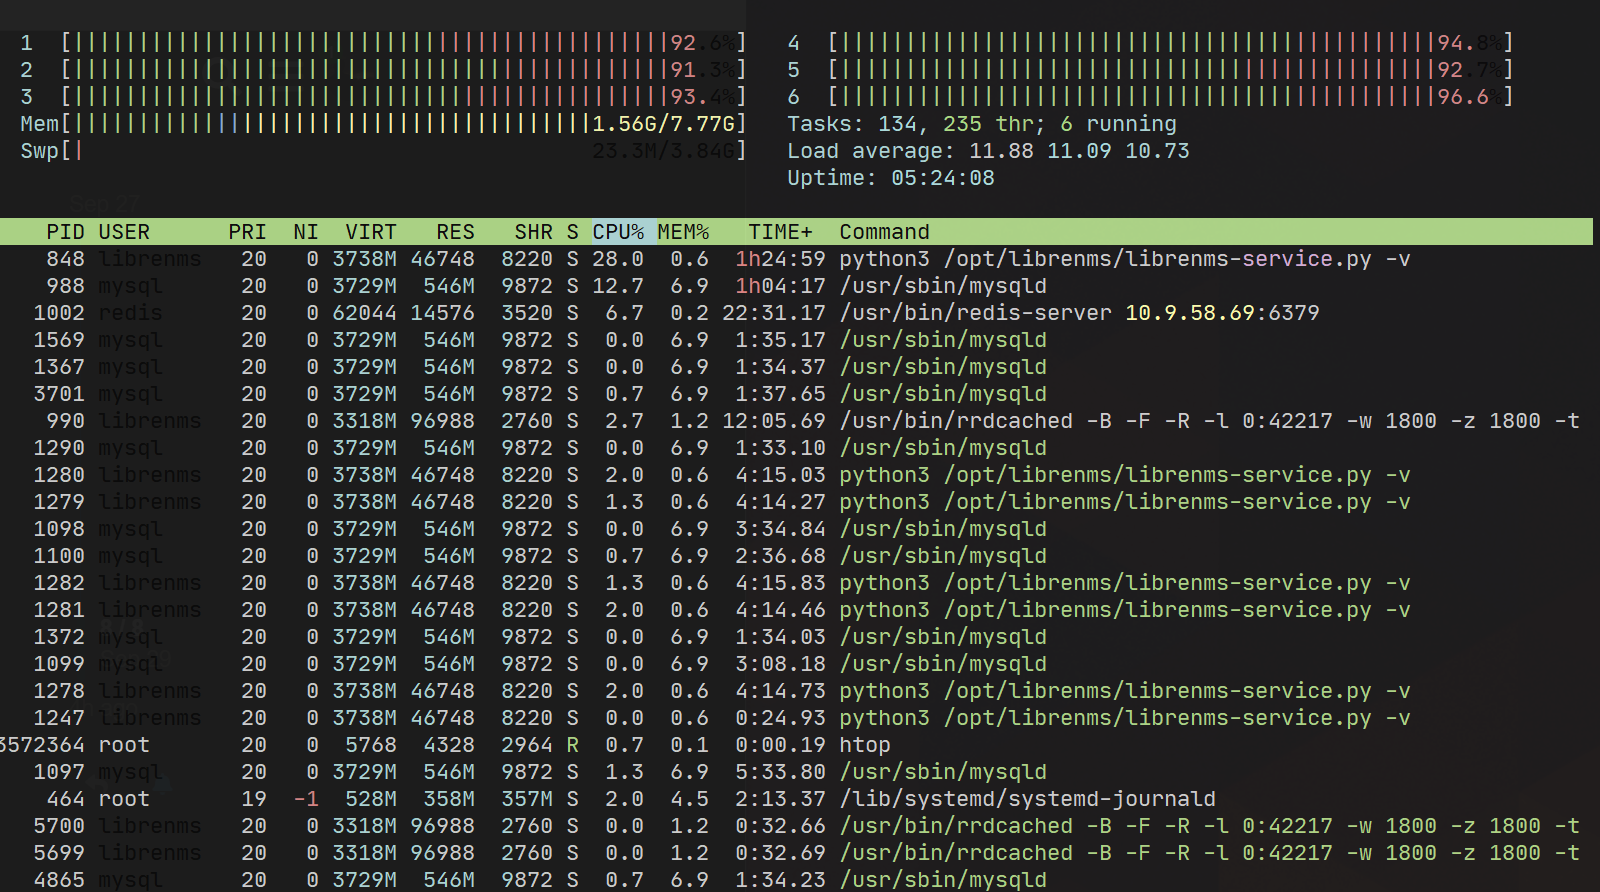
Yeah, glad you think that too cos definitely not what I expected either. I was seeing 2-6 discovery.php processes start every second! We have about 900 devices so I wouldn’t expect that many! Most likely the reason my CPU was maxing out though. I didn’t upgrade to php8.1 or Ubuntu 22, and we’re on monthly release so no code changes that I know of that night! What’s more it all settled after 38 hours with no intervention. And to top it off, CPU now running at 45% average rather than 70% previously. It doesn’t really make sense! Oh and my daily.sh log file has no entries for the time it went weird.
Only common feature with @Hans_Oele is we’re both running Ubutnu so maybe it’s Ubuntu issue or python on Ubuntu issue. Not sure how to find out retrospectively.
@murrant what do you put the spike in traffic on you graph down too?