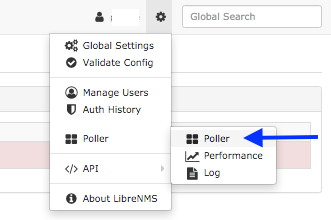
Hello,
Somehow de high CPU is solved for the moment.
I think i had to many pollers open in the cronjob i have solved this to only start 1 poller.
But what i see in de validate.php is a FAIL of polling the localhost.
The poller (RFH-PI-GSN-523) has not completed within the last 5 minutes, check the cron job.
This is the server where Librenms is running from.
I try to reach him on the local adres (127.0.0.0)
if i run ./poller.php -h localhost i get the following output:
[root@RFH-PI-GSN-523 librenms]# ./poller.php -h localhost
LibreNMS Poller
Starting polling run:
Hostname: localhost
Device ID: 19
OS: linux
Resolved IP: 127.0.0.1
(unix)
Load poller module core
Uptime: 21 hours 48 minutes 3 seconds
Runtime for poller module ‘core’: 0.0252 seconds with 80184 bytes
SNMP: [2/0.02s] MySQL: [0/0.00s] RRD: [1/0.00s]
Unload poller module core
Module [ unix-agent ] disabled globally.
Load poller module os
Hardware: Generic x86 64-bit
Version: 4.18.0-147.5.1.el8_1.x86_64
Features: CentOS 8.1.1911
Serial:
Runtime for poller module ‘os’: 0.2153 seconds with 57632 bytes
SNMP: [10/0.21s] MySQL: [0/0.00s] RRD: [1/0.00s]
Unload poller module os
Module [ ipmi ] disabled globally.
Load poller module sensors
Runtime for poller module ‘sensors’: 0.0008 seconds with 1464 bytes
SNMP: [0/0.00s] MySQL: [1/0.00s] RRD: [1/0.00s]
Unload poller module sensors
Load poller module processors
29%
28%
Runtime for poller module ‘processors’: 0.0302 seconds with 94136 bytes
SNMP: [1/0.02s] MySQL: [3/0.00s] RRD: [3/0.00s]
Unload poller module processors
Load poller module mempools
Mempool Physical memory: 49.52%
Mempool Virtual memory: 32.74%
Mempool Swap space: 0.36%
Runtime for poller module ‘mempools’: 0.0246 seconds with 21232 bytes
SNMP: [2/0.02s] MySQL: [4/0.01s] RRD: [4/0.00s]
Unload poller module mempools
Load poller module storage
Storage /dev/shm: hrstorage
0%
Storage /run: hrstorage
0%
Storage /sys/fs/cgroup: hrstorage
0%
Storage /: hrstorage
49%
Storage /boot: hrstorage
25%
Storage /boot/efi: hrstorage
1%
Storage /run/user/986: hrstorage
0%
Storage /run/user/1001: hrstorage
0%
Runtime for poller module ‘storage’: 0.0056 seconds with 3040 bytes
SNMP: [0/0.00s] MySQL: [9/0.00s] RRD: [9/0.00s]
Unload poller module storage
Load poller module netstats
ICMP IP IP-FORWARD SNMP TCP TCPHC UDP
Runtime for poller module ‘netstats’: 0.0770 seconds with 35600 bytes
SNMP: [7/0.08s] MySQL: [0/0.00s] RRD: [6/0.00s]
Unload poller module netstats
Load poller module hr-mib
Processes Users
Runtime for poller module ‘hr-mib’: 0.0080 seconds with 3184 bytes
SNMP: [1/0.01s] MySQL: [0/0.00s] RRD: [3/0.00s]
Unload poller module hr-mib
Load poller module ucd-mib
Runtime for poller module ‘ucd-mib’: 0.0212 seconds with 11032 bytes
SNMP: [3/0.02s] MySQL: [0/0.00s] RRD: [18/0.00s]
Unload poller module ucd-mib
Load poller module ipSystemStats
ipv4 ipv6
Runtime for poller module ‘ipSystemStats’: 0.0114 seconds with 17808 bytes
SNMP: [1/0.01s] MySQL: [0/0.00s] RRD: [3/0.00s]
Unload poller module ipSystemStats
Load poller module ports
Caching Oids: Full ports polling ifDescr ifAdminStatus ifOperStatus ifLastChange ifType ifPhysAddress ifMtu ifInErrors ifOutErrors ifInDiscards ifOutDiscards dot3StatsDuplexStatus
Port lo: lo (1 / #422) VLAN = lobps(5.91 kbps/5.91 kbps)bytes(26.71 kB/26.71 kB)pkts(4.59 pps/4.59 pps)
Port eth0: eth0 (2 / #423) dot3Duplex VLAN = eth0bps(361.75 kbps/148.76 kbps)bytes(1.6 MB/671.89 kB)pkts(183.59 pps/179.49 pps)
Runtime for poller module ‘ports’: 0.1117 seconds with 30168 bytes
SNMP: [14/0.10s] MySQL: [5/0.00s] RRD: [3/0.00s]
Unload poller module ports
Load poller module customoid
Runtime for poller module ‘customoid’: 0.0005 seconds with 2040 bytes
SNMP: [0/0.00s] MySQL: [1/0.00s] RRD: [1/0.00s]
Unload poller module customoid
Module [ bgp-peers ] disabled on os.
Module [ junose-atm-vp ] disabled globally.
Module [ toner ] disabled globally.
Load poller module ucd-diskio
sda sda1 sda2 sda3 dm-0 dm-1
Runtime for poller module ‘ucd-diskio’: 0.0093 seconds with 7720 bytes
SNMP: [1/0.01s] MySQL: [1/0.00s] RRD: [7/0.00s]
Unload poller module ucd-diskio
Module [ wifi ] disabled globally.
Module [ wireless ] disabled globally.
Module [ ospf ] disabled on os.
Module [ cisco-ipsec-flow-monitor ] disabled globally.
Module [ cisco-remote-access-monitor ] disabled globally.
Module [ cisco-cef ] disabled globally.
Module [ cisco-sla ] disabled globally.
Module [ cisco-mac-accounting ] disabled globally.
Module [ cipsec-tunnels ] disabled globally.
Module [ cisco-ace-loadbalancer ] disabled globally.
Module [ cisco-ace-serverfarms ] disabled globally.
Module [ cisco-asa-firewall ] disabled globally.
Module [ cisco-voice ] disabled globally.
Module [ cisco-cbqos ] disabled globally.
Module [ cisco-otv ] disabled globally.
Module [ cisco-qfp ] disabled globally.
Module [ cisco-vpdn ] disabled globally.
Module [ nac ] disabled globally.
Module [ netscaler-vsvr ] disabled globally.
Module [ aruba-controller ] disabled globally.
Load poller module entity-physical
Runtime for poller module ‘entity-physical’: 0.0005 seconds with 1976 bytes
SNMP: [0/0.00s] MySQL: [1/0.00s] RRD: [1/0.00s]
Unload poller module entity-physical
Module [ entity-state ] disabled globally.
Load poller module applications
Runtime for poller module ‘applications’: 0.0004 seconds with 1472 bytes
SNMP: [0/0.00s] MySQL: [1/0.00s] RRD: [1/0.00s]
Unload poller module applications
Module [ mib ] disabled globally.
Module [ stp ] disabled on os.
Load poller module ntp
Runtime for poller module ‘ntp’: 0.0001 seconds with 320 bytes
SNMP: [0/0.00s] MySQL: [0/0.00s] RRD: [1/0.00s]
Unload poller module ntp
Module [ loadbalancers ] disabled globally.
Module [ mef ] disabled globally.
Module [ mpls ] disabled globally.
Load poller module services
Runtime for poller module ‘services’: 0.0000 seconds with 0 bytes
SNMP: [0/0.00s] MySQL: [0/0.00s] RRD: [1/0.00s]
Unload poller module services
Start Device Groups
End Device Groups, runtime: 0.0096s
Enabling graphs: uptime netstat_icmp netstat_icmp_info netstat_ip netstat_ip_frag netstat_snmp netstat_snmp_pkt netstat_tcp netstat_udp hr_processes hr_users ucd_cpu ucd_swap_io ucd_io ucd_contexts ucd_interrupts ucd_memory ucd_load ipsystemstats_ipv4 ipsystemstats_ipv4_frag ipsystemstats_ipv6 ipsystemstats_ipv6_frag
Polled in 1.61 seconds
Start Alerts
End Alerts
SNMP [43/0.52s]: Get[19/0.32s] Getnext[4/0.03s] Walk[20/0.17s]
MySQL [33/0.03s]: Cell[1/0.00s] Row[-1/-0.00s] Rows[12/0.01s] Column[0/0.00s] Update[19/0.02s] Insert[2/0.00s] Delete[0/0.00s]
RRD [67/0.00s]: Update[67/0.00s] Create [0/0.00s] Other[0/0.00s]
