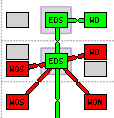
I’ve installed weathermap, and I’m looking to create an image where it shows whether the NODE is UP or DOWN. I’d like it to be green when the device is functioning normally, and turn it to red when it’s malfunctioning. However, it seems to be just white.
Currently, my LINK can change its color based on bandwidth, but the NODE is always white. I’m not sure where I went wrong with the settings. Below is my configuration file.
HTMLSTYLE overlib
HTMLOUTPUTFILE A_Rack.html
IMAGEOUTPUTFILE A_Rack.png

KEYPOS DEFAULT -1 -1 Traffic Load
KEYTEXTCOLOR 0 0 0
KEYOUTLINECOLOR 0 0 0
KEYBGCOLOR 255 255 255
BGCOLOR 255 255 255
TITLECOLOR 0 0 0
TIMECOLOR 0 0 0

# Define color scales
SCALE green 0 0   0 255 0     # Green color range for normal status
SCALE red 1 1   255 0 0       # Red color range for abnormal status

# Default settings
SET key_hidezero_DEFAULT 1

# TEMPLATE-only NODEs:
NODE DEFAULT
    MAXVALUE 100

# TEMPLATE-only LINKs:
LINK DEFAULT
    BANDWIDTH 100M

# Regular NODEs:
NODE 22
    LABEL Switch6
    INFOURL http://192.168.90.99/device/device=22/
    OVERLIBGRAPH http://192.168.90.99/graph.php?height=100&width=512&device=22&type=device_bits&legend=no
    POSITION 142 155

    # Use USESCALE to specify colors
    USESCALE green absolute
    USESCALE red absolute
    SET category bandwidth