Fix it
I fix some permission updates in librenms with:
sudo chown -R librenms:librenms /opt/librenms
sudo setfacl -d -m g::rwx /opt/librenms/rrd /opt/librenms/logs /opt/librenms/bootstrap/cache/ /opt/librenms/storage/
sudo chmod -R ug=rwX /opt/librenms/rrd /opt/librenms/logs /opt/librenms/bootstrap/cache/ /opt/librenms/storage/
and delete and recreate the services again.
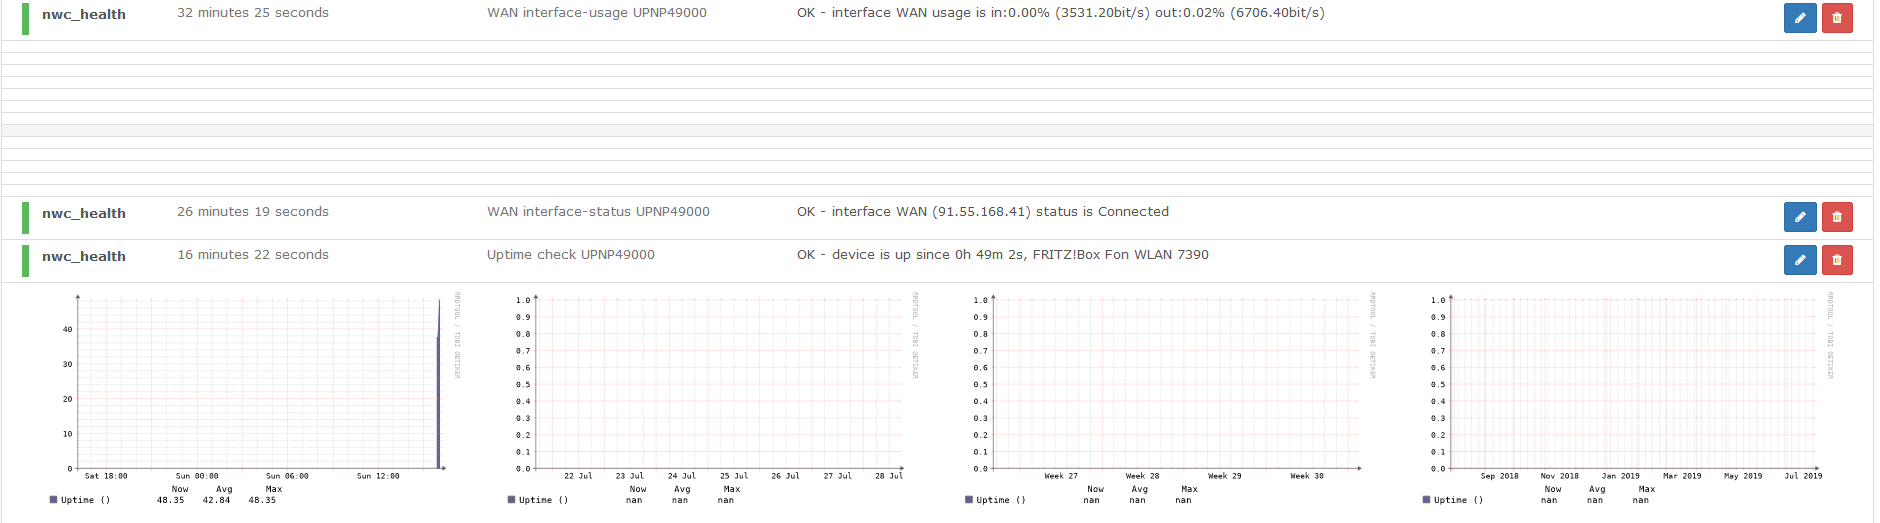
Now its generates graphs for my upnp interface_usage, interface_status and uptime service. 
Hotow:
I used the “check_nwc_health” https://labs.consol.de/nagios/check_nwc_health/index.html#download script by using this german guideline https://blog.mansshardt.net/monitoring-einer-fritzbox-7390-mit-nagios/ which is original for nagios but it works for Librenms too.
Step 1: Install dependencies
Certain Perl modules are required for the plugin to function correctly. These can be installed with the help of apt.
apt-get install libsoap-lite-perl libxml-libxml-perl libjson-perl build-essential
Step 2: Download and unzip the plugin
(use latest version from https://labs.consol.de/nagios/check_nwc_health/#download
ssh -l username librenms-ip
sudo -i
cd /usr/lib/nagios/plugins
wget https://labs.consol.de/assets/downloads/nagios/check_nwc_health-7.10.0.6.tar.gz
A more recent version of the plugin may already be available at http://labs.consol.de/nagios/check_nwc_health/_nwc_health/.
Roof of the download check_nwc_health must be unpacked.
tar xzf check_nwc_health-7.10.0.6.tar.gz
Step 3: Install the plugin
To install check_nwc_health, first change to the directory that was unpacked in step 2.
cd check_nwc_health-7.10.0.6
Afterwards the script must be configured for the installation with the following command:
./configure
After that, it is compiled with make.
make
Since only one of the compiled files is needed, you can save “make install” at this point.
Under Debian the Nagios plugins are located under /usr/lib/nagios/plugins by default. This is where it has to be moved now.
mv plugins-scripts/check_nwc_health /usr/lib/nagios/plugins/
The Nagios plugin check_nwc_health is now installed.
Step 4: Add Services in LibreNMS
- Goto your LibreNMS Add Services Webpage
http://librenms/addsrv and choose your “fritz.box” Device.
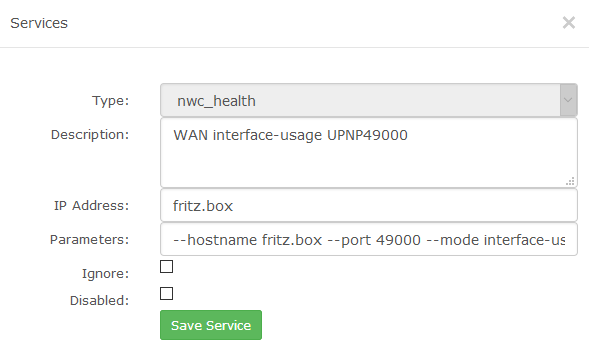
- Choose as Type “check_nwc_health”
- Enter a “Description” (optional)
- Let the IP Address field empty
- Under Parameters you can enter the following parameters: (use your fritz.box IP or DNS name)
To see WAN interface-usage
--hostname fritz.box --port 49000 --mode interface-usage
To see WAN interface-status
--hostname fritz.box --port 49000 --mode interface-status
To see Uptime check UPNP49000
--hostname fritz.box --port 49000 --mode uptime
After that you will see the services in LibreNMS and created RRD graphs.
Troubleshooting
If you got a permission file system error check during first check of nwc_health service, fix it with root privilges on SSH CLI:
ssh -l username librenms-ip
sudo -i
cd /var/tmp/
chmod librenms:librenms +R check_nwc_health
The service can be directly checked via SSH CLI if you like:
ssh -l username librenms-ip
sudo -i
cd /usr/lib/nagios/plugins

./check_nwc_health --hostname fritz.box --port 49000 --mode interface-usage
 OK - interface WAN usage is in:0.32% (315740.55bit/s) out:0.07% (21574.67bit/s) | 'WAN_usage_in'=0.32%;80;90;0;100 'WAN_usage_out'=0.07%;80;90;0;100 'WAN_traffic_in'=315740.55;78649600;88480800;0;98312000 'WAN_traffic_out'=21574.67;26003200;29253600;0;32504000

./check_nwc_health --hostname fritz.box --port 49000 --mode interface-status
 OK - interface WAN (91.55.168.41) status is Connected

./check_nwc_health --hostname fritz.box --port 49000 --mode uptime
 OK - device is up since 1h 51m 40s, FRITZ!Box Fon WLAN 7390 | 'uptime'=112;15:;5:;;
If you still have problems by creating RRD graphs, Validate your libreNMS config http://librenms/validate if you have some folder permission issues and fix that with:
sudo chown -R librenms:librenms /opt/librenms
sudo setfacl -d -m g::rwx /opt/librenms/rrd /opt/librenms/logs /opt/librenms/bootstrap/cache/ /opt/librenms/storage/
sudo chmod -R ug=rwX /opt/librenms/rrd /opt/librenms/logs /opt/librenms/bootstrap/cache/ /opt/librenms/storage/
Thats it!
Hope it works on your installation as well and you could enjoy it!