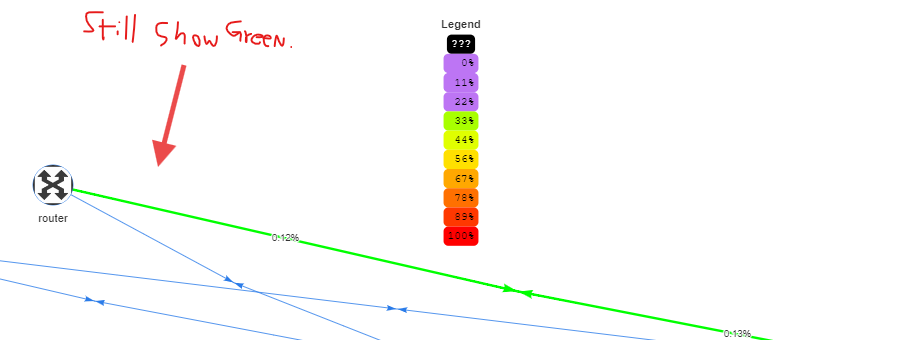
I need to add new color range 1 - 25% with purple colour so I edit file customer-view.blade.php then the legend shows purple for 1-25% but at the link traffic below 25% is still shown in green color how do I fix it?
/resources/views/map/customer-view.blade.php#BD75F4 ’;#ff ’ + parseInt(5.1 * (100.0 - pct)).toString(16).padStart(2, 0) + ‘00’;#ff00 ’ + parseInt(5.1 * (pct - 100.0)).toString(16).padStart(2, 0);
I’m not very familiar with custom map code, but have you had a look at this function?
          {
              return Number::formatSi($rate, 0, 0, 'bps');
          }

          private function snmpSpeed(string $speeds): int
          {
              // Only succeed if the string starts with a number optionally followed by a unit, return 0 for non-parsable
              return (int) Number::toBytes($speeds);
          }

          private function speedColour(float $pct): string
          {
              // For the maths below, the 5.1 is worked out as 255 / 50
              // (255 being the max colour value and 50 is the max of the $pct calculation)
              if ($pct <= 0) {
                  // Black if we can't determine the percentage (link down or speed 0), or link speed strictly 0
                  return '#000000';
              } elseif ($pct < 50) {
                  // 100% green and slowly increase the red until we get to yellow
                  return sprintf('#%02XFF00', (int) (5.1 * $pct));
              } elseif ($pct < 100) {
Also, it might be worth checking out the file changes for original PR for custom maps. I’m sure there have been change/modifications since then, but it might help give you an idea what all files make up the feature.
librenms:master ← eskyuu:custommap
opened 06:09AM - 12 Dec 23 UTC
This adds functionality for admins to create weather maps.
Overview:
- Maps… have been created using the vis.js library, but with all physics and interactions disabled
- Editing is done using the vis.js editor
- In order to allow for 2-way traffic reporting and multiple links between nodes, a mid-point is created for each line. This can be dragged around in the editor, but is hidden in the viewer.
- A background image can be added as long as it is under 2MB in size
- Background images are stored in a separate table in the database so they are not fetched every time the map is viewed
- Background images are cached to disk, and streamed from disk to the client to avoid fetching binary blobs from the database regularly
- "Nodes" can added to the map can optionally be associated with a LibreNMS device
- If either end of a link is associated with as device, the link can be associated with a port
- If a link is associated with a port, it will show percentage utilisation (this can be turned off)
- It will attempt to decode the SNMP speed if it is set
- It will make the lines wider for faster links
- Lines will change colour on a continuous scale from green->yellow->red based on link percentage utilisation (0->50->100)
- Lines will change from red->purple if the link utilisation is calculated over 100%
- Access to a given custom map either requires global read access, or access to ALL devices on the custom map. If a custom map does not have any linked devices, it will only be visible to users with global read.
- The viewer will refresh the data based on the polling interval, and update the map accordingly
I would appreciate any testing and/or comments on getting it working in its current form.
I do still have a couple of ideas to implement to improve the UI.
DO NOT DELETE THE UNDERLYING TEXT
#### Please note
> Please read this information carefully. You can run `./lnms dev:check` to check your code before submitting.
- [ ] Have you followed our [code guidelines?](https://docs.librenms.org/Developing/Code-Guidelines/)
- [ ] If my Pull Request does some changes/fixes/enhancements in the WebUI, I have inserted a screenshot of it.
- [ ] If my Pull Request makes discovery/polling/yaml changes, I have added/updated [test data](https://docs.librenms.org/Developing/os/Test-Units/).
#### Testers
If you would like to test this pull request then please run: `./scripts/github-apply <pr_id>`, i.e `./scripts/github-apply 5926`
After you are done testing, you can remove the changes with `./scripts/github-remove`. If there are schema changes, you can ask on discord how to revert.
Dear slashdoom,
Thank you very much. after I edited the function speedColour, the link’s color changed.
1 Like
system
4 November 2024 02:14
4
This topic was automatically closed 90 days after the last reply. New replies are no longer allowed.