This is my top 10 dashboard widget:
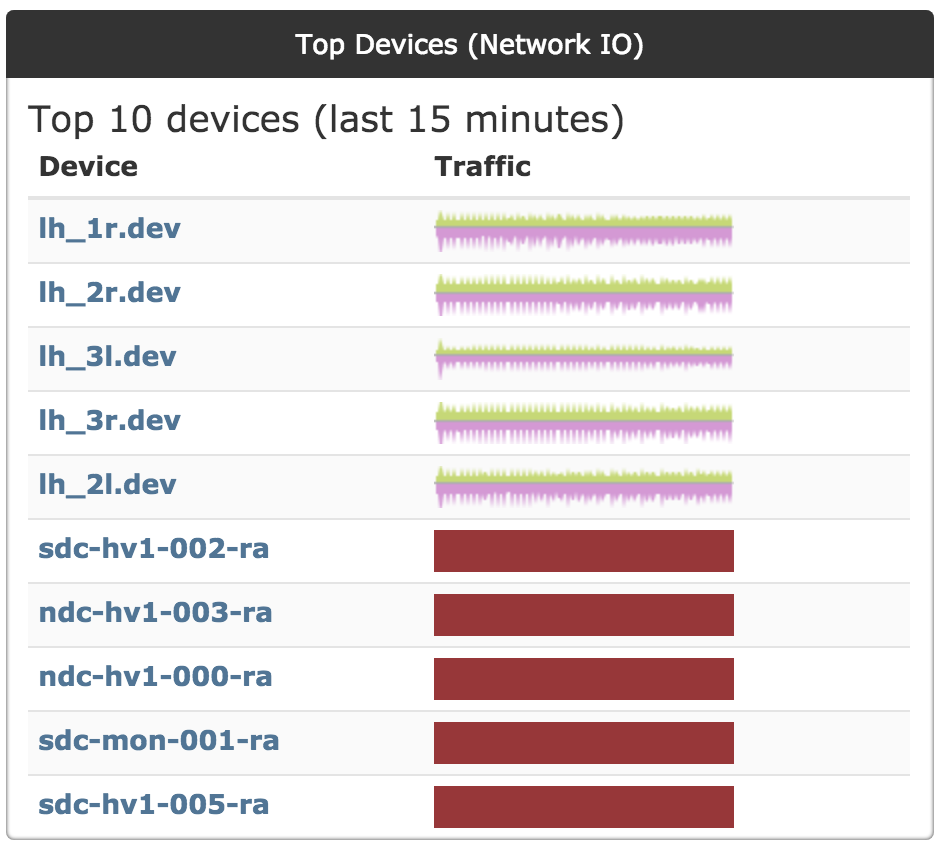
I would expect our 2 SRX5800’s to be somewhere near the top of that list, rather than the weedy APC PDU’s in our lab network. The red graphs are Dell iDrac - I don’t think they support traffic stats.
The top device in the list is running at 500 bytes/second.
Not a new thing, been like this since the deployment was new - just coming up on my “list of weird things to look at”.
$ ./validate.php
====================================
Component | Version
--------- | -------
LibreNMS  | 1.40-31-g9ff9dbc
DB Schema | 253
PHP       | 7.1.14
MySQL     | 5.5.56-MariaDB
RRDTool   | 1.4.8
SNMP      | NET-SNMP 5.7.2
====================================

[OK]    Composer Version: 1.6.5
[OK]    Dependencies up-to-date.
[OK]    Database connection successful
[OK]    Database schema correct
[FAIL]  The poller has never run or you are not using poller-wrapper.py, check the cron job.
[WARN]  Your install is over 24 hours out of date, last update: Thu, 14 Jun 2018 09:29:03 +0000
        [FIX] Make sure your daily.sh cron is running and run ./daily.sh by hand to see if there are any errors.
[WARN]  Your local git branch is not master, this will prevent automatic updates.
        [FIX] You can switch back to master with git checkout master