If I want to add a new graph to a system what methods are there?
I use the “Apps” for some systems with common apps, but if I need to monitor a value that is not in the list of apps?
Example:
If I have a server running an application with a number of users connected and I want to have a graph of this number of users. I can easily make a script that returns the number of users (which can be run fron the snmpd).
But how do I add this “myApp” to the list of Applications to show the graph?
Or is there another method for adding graphs that is not included “out of the box”?
there is a bunch of Applications integrated. If you have one which isn’t it would be appreciated if you write a Pull Request which enhances System with this.
I have used some of the included Apps and know how they work, but I am not a developer…
(I can write small programs in several languages like perl, bash, powershell, js, …).
Many of the things I want to have a graphics on is not of general interest (ie internal system statistics stuff).
I simply want a way to present a value X from a server Y as a graph in LibreNMS. Simple as that…
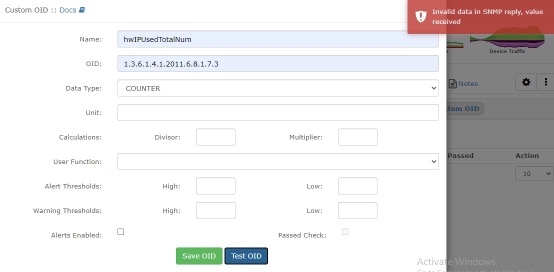
When I test this from the librenms ui I get “Invalid data in snmp reply, value received”
name: test101
oid: .1.2.3.4.5.6.7.8.9.101
Data type: gauge
Unit: number of users
Question 1:
What oid can I use for a simple number of users in an internal applications (ie the value I want to monitor in a graph). I just tested with a self-made oid number.
Question 2:
Is this documented someware with a simple example?