How to force graph Y scale to start at zero

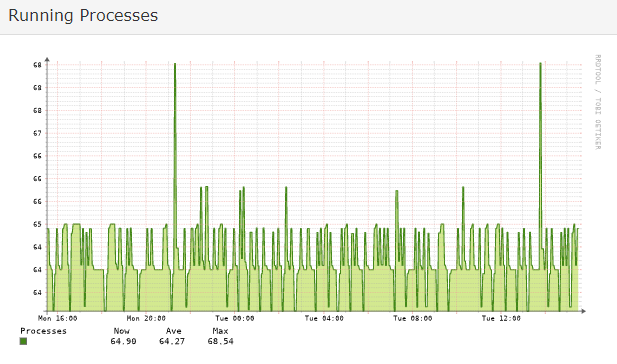
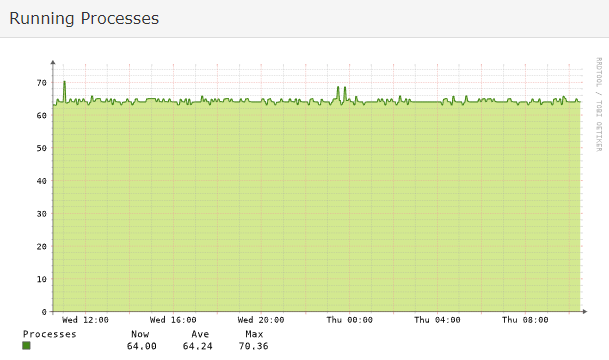
All of my graphs used to have a minimum value of 0 on the Y scale, but something changed recently (within the last week or so) because now some (but not all) or my graphs seem to have a Y scale that’s changing so that the minimum value is the smallest value in the data set. For example:

image

This is not what I want - I always want the minimum value to be zero. Is there some configuration option to force this?

In addition, I just noticed that the Y scale shown above on the screenshot doesn’t really make any sense with the multiple duplicate values :thinking:. I’m guessing this is due to rounding to int values?

I wonder if it’s something to do with this patch?

Awesome, there were two different variables to set the graph window, sigh. I’ll get a fix sent.

Thanks for reporting! (especially including the graph image)

1 Like

Was actually something totally different than my first guess :smiley:

Fixed in Fix scale when it is zero by murrant · Pull Request #14560 · librenms/librenms · GitHub

Cool, I’ll check tomorrow after the daily update :+1:

1 Like

All fixed now :+1:

image

1 Like

This topic was automatically closed 7 days after the last reply. New replies are no longer allowed.