I didn’t even really make it I just upgraded the one that was out there. The old version was limited to 1Gb Internet connections and had some errors in the setup documentation. I’ve also changed how the graphs are displayed and tweaked the graphs themselves. I can’t promise I’ll do better than Jack for support, but check it out: GitHub - gitterdoneplease/librenms-speedtest-NG: plugin for LibreNMS to graph Ookla speedtest results
5 Likes
I just (minutes ago) fixed my issues with the speedtest graphs, due to a previous post you had regarding the speed limitations.
Going to test yours out now to see how it looks.
Thanks to you for (and Jack for all the initial work),
Joel
Make sure you update the Cron job. The previous version had an error. Should be */30 not just 30. Took me a minute to notice that error.
If you change the RRDs you’ll need to run “create” again.
If you wanted to take this a bit further you could update it to a v2 plugin.
That would allow users to install it with one command lnms plugin:add
Also, you could use LibreNMS (Laravel’s) built in scheduler to run the speedtests so users would not have to set it up via cron.
1 Like
I’m never going to get any data plotted at this rate. ![]()
Are there any docs that you recommend for converting to a v2 plugin?
1 Like
Most of the documentation is here: Package Development - Laravel 12.x - The PHP Framework For Web Artisans
Hi,
crontab is running spedtest every 30 minutes
RRDs and graph PNGs updated
Speedtest plugin enabled in Librenms, but still graphs not visible on plugin page
In addition there are errors with "Permission Denied: for logo PNGs in image Speedtest plugin directory
Does it need some additional config for ngnix vhost site configuration ?
BR
Dimitar
Hi Dimitar!
Can you please send the output of a “ls -al /opt/librenms/html/plugins/Speedtest”?
Hi,
:~#]ls -al /opt/librenms/html/plugins/Speedtest
total 100
drwxr-x— 7 librenms librenms 4096 Jun 15 20:09 ./
drwxr-xr-x 3 librenms librenms 4096 Jun 15 08:56 …/
drwxr-x— 8 librenms librenms 4096 Jun 15 08:56 .git/
drwxr-x— 2 librenms librenms 4096 Jun 15 12:16 images/
-rwxr-x— 1 librenms librenms 14722 Jun 15 09:15 librenms-speedtest.sh*
-rw-r----- 1 librenms librenms 35091 Jun 15 08:56 LICENSE
drwxr-x— 2 librenms librenms 4096 Jun 15 09:10 png/
-rw-r----- 1 librenms librenms 4382 Jun 15 08:56 README.md
drwxr-x— 2 librenms librenms 4096 Jun 15 09:09 rrd/
-rw-r----- 1 librenms librenms 5620 Jun 15 08:56 Speedtest.inc.php
-rw-r----- 1 librenms librenms 226 Jun 15 20:09 Speedtest.php
drwxr-x— 2 librenms librenms 4096 Jun 15 09:01 tmp/
OK, I’ll look at my instructions again, but your perms are not 755 on the dirs. Can you try running that part of the instructions again?
Here are mine (they need to be recursive -R keep in mind):
# ls -al /opt/librenms/html/plugins/Speedtest
total 116
drwxr-xr-x 7 librenms librenms  4096 Jun  8 20:09 .
drwxr-xr-x 3 librenms librenms  4096 Jun  7 14:45 ..
drwxr-xr-x 8 librenms librenms  4096 Jun  7 14:39 .git
-rwxr-xr-x 1 librenms librenms 35091 Jun  7 14:39 LICENSE
-rwxr-xr-x 1 librenms librenms  4382 Jun  7 14:39 README.md
-rwxr-xr-x 1 librenms librenms  8045 Jun  9 09:17 Speedtest.inc.php
-rwxr-xr-x 1 librenms librenms   144 Jun  7 14:39 Speedtest.php
drwxr-xr-x 2 librenms librenms  4096 Jun  7 14:39 images
-rwxr-xr-x 1 librenms librenms  6377 Jun  8 20:20 librenms-speedtest.sh
drwxr-xr-x 2 librenms librenms  4096 Jun  8 19:23 png
drwxr-xr-x 2 librenms librenms  4096 Jun  8 16:00 rrd
drwxr-xr-x 2 librenms librenms  4096 Jun  7 15:30 tmp
My nginx is running as www-data, I assume yours is?
# ps aux | grep -i nginx
root       27829  0.0  0.0   3308  1536 pts/3    S+   20:12   0:00 grep --color=auto -i nginx
root     1112345  0.0  0.0  45460  3652 ?        Ss   Jun05   0:00 nginx: master process /usr/sbin/nginx -g daemon on; master_process on;
www-data 1113375  0.0  0.1  46280  5140 ?        S    Jun05   0:01 nginx: worker process
www-data 1113376  0.0  0.1  46276  7648 ?        S    Jun05   0:01 nginx: worker process
www-data 1113377  0.0  0.1  46276  7836 ?        S    Jun05   0:01 nginx: worker process
www-data 1113378  0.0  0.2  46276  8892 ?        S    Jun05   0:01 nginx: worker process
Setup some group perms and I think you’ll be on your way!
1 Like
The instructions are to change perms 750 for dirs and executables
And 640 for other files
But adduser www-data librenms seems fixed that problem ![]()
Now logo PNG are OK
I still have problem with visualizing PNG graphs
When refreshed only this error appear in error.log
2025/06/18 21:21:49 [error] 467944#467944: *47 FastCGI sent in stderr: “PHP message: PHP Error(8192): Calling get_class() without arguments is deprecated in /opt/librenms/html/plugins/Speedtest/Speedtest.php:5; PHP message: PHP Error(8192): Calling get_class() without arguments is deprecated in /opt/librenms/html/plugins/Speedtest/Speedtest.php:5” while reading response header from upstream, client: 192.168.88.171, server: librenms.domain.com, request: “GET /plugin/v1/Speedtest HTTP/1.1”, upstream: “fastcgi://unix:/run/php-fpm-librenms.sock:”, host: “librenms.domain.com”, referrer: “http://librenms.domain.com/”
I tried something on Speedtest.php:
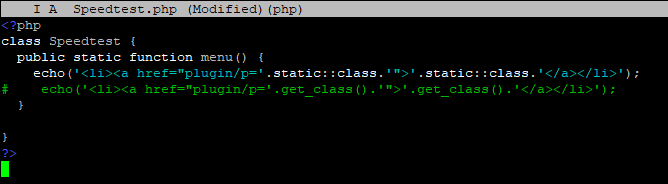
No errors now , but graph PNG still not shown ![]()
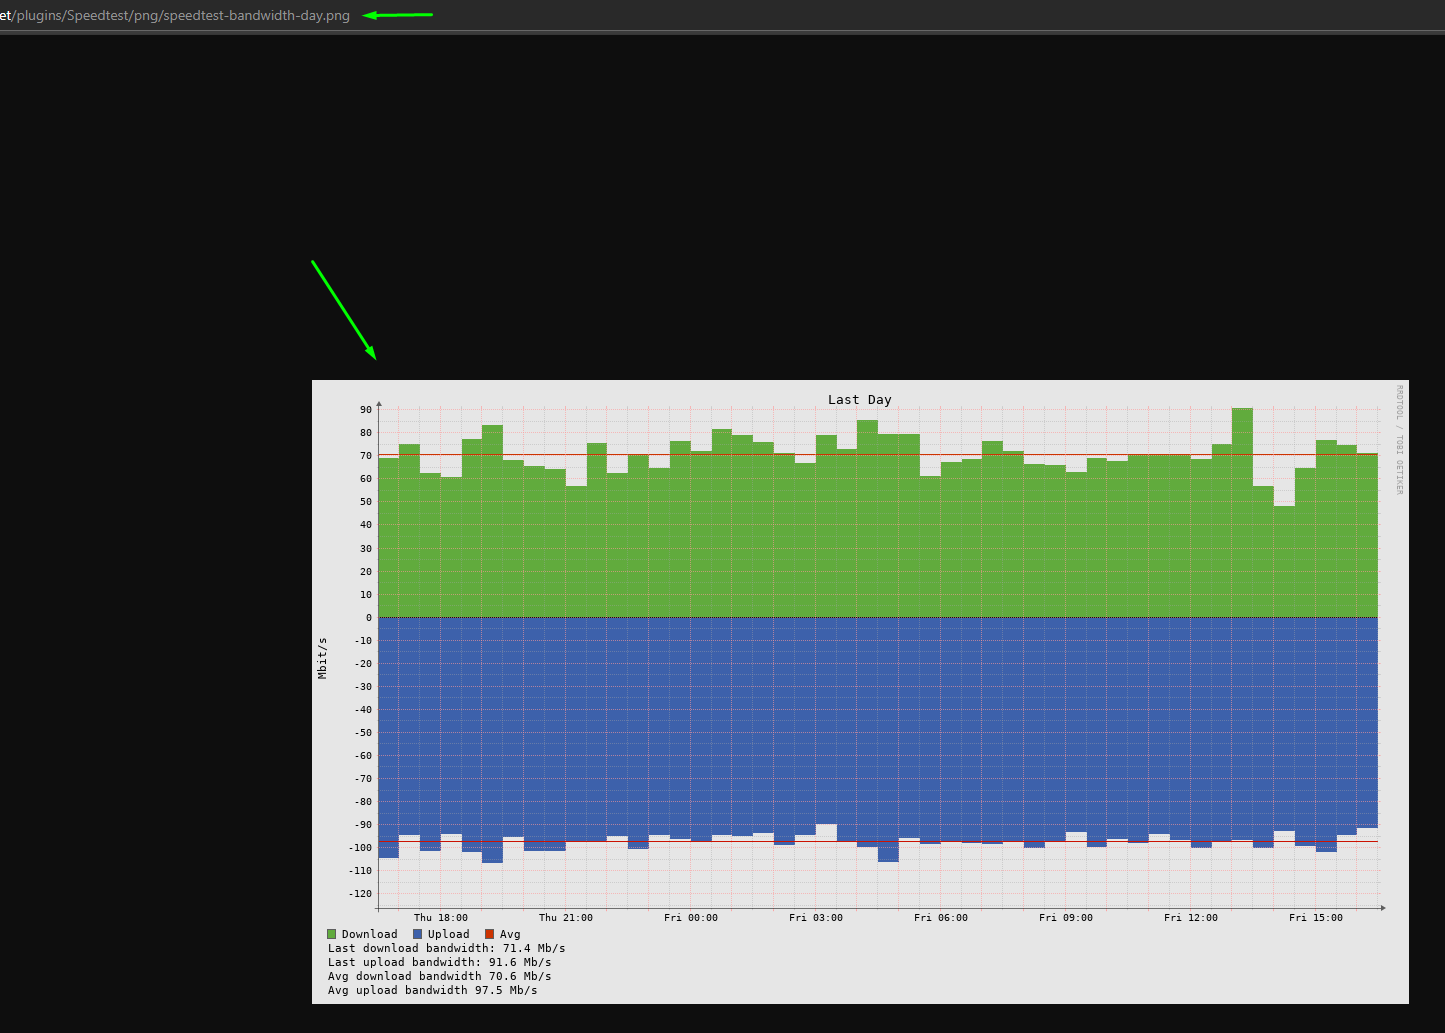
Seems img src is correct and when load it in a separate window it opens correctly
But on Speedtes plugin page PNG graphs are not shown
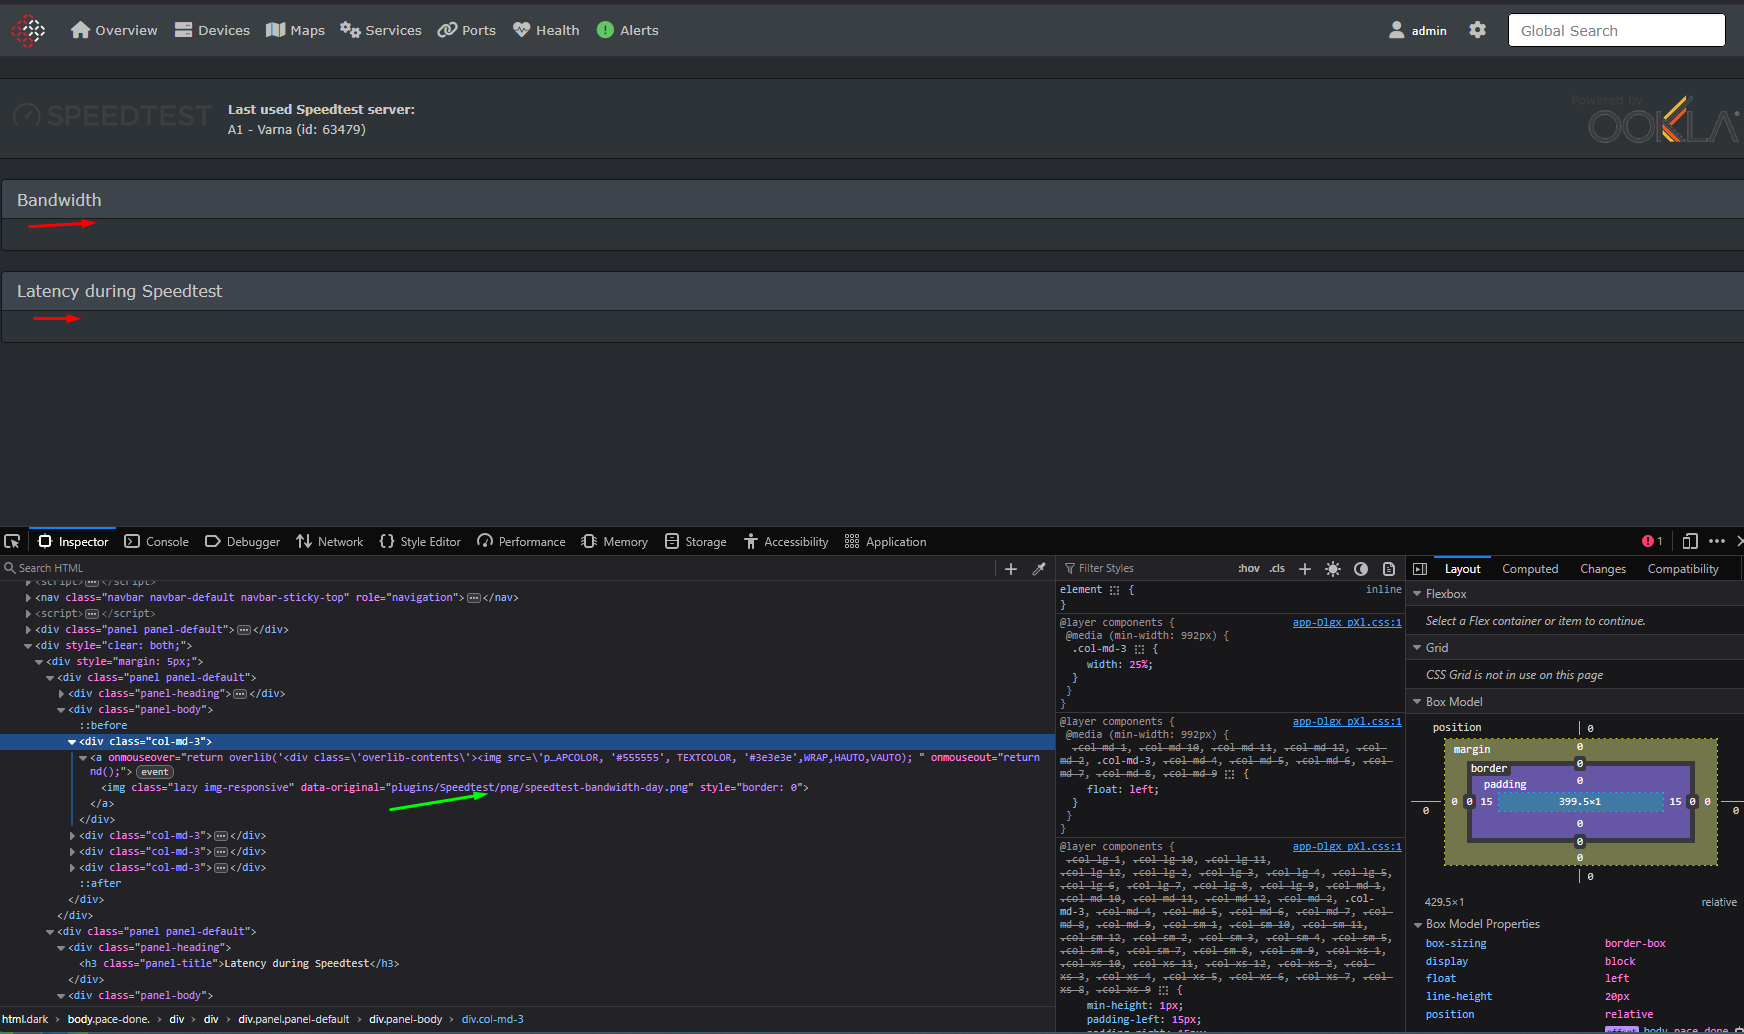
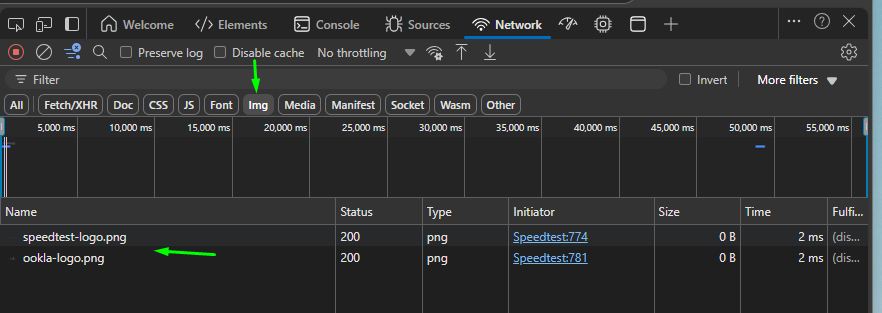
Also in Network trace I dont see graph png loaded
I’ll have to update my instructions. Thanks for that.
This bit here:
server: librenms.domain.com, request: “GET /plugin/v1/Speedtest HTTP/1.1”, upstream: “fastcgi://unix:/run/php-fpm-librenms.sock:”, host: “librenms.domain.com”, referrer: “http://librenms.domain.com/”
Is that what is set in /etc/nginx/conf.d/librenms.conf?
If you pull the PNGs off of your server manually are they being created correctly?
No, conf.d directory is emtpy , but this is vhost site configuration for librenms
server {
listen 80;
server_name librenms.domain.com;
root /opt/librenms/html;
index index.php;
charset utf-8;
gzip on;
gzip_types text/css application/javascript text/javascript application/x-javascript image/svg+xml text/plain text/xsd text/xsl text/xml image/x-icon;
location / {
try_files $uri $uri/ /index.php?$query_string;
}
location ~ [^/].php(/|$) {
fastcgi_pass unix:/run/php-fpm-librenms.sock;
fastcgi_split_path_info ^(.+.php)(/.+)$;
include fastcgi.conf;
}
location ~ /.(?!well-known).* {
deny all;
}
location ~ .(css|js|png|jpg|jpeg|gif|ico|woff|ttf|svg|eot)$ {
try_files $uri $uri/ =404;
}
and it looks like it covers /plugins/Speedtest/ , as well ?
Yes, if I pull grap img src directly its shown and it is recent/correct
But on Speedtest plugin frame inside librenms they are still not shown, although the source looks like it must be shown
Hi,
Seems the fix for that issue is a bit old ![]()
Graphs not showing (#2) · Issue · jackgreyhat/librenms-speedtest
Now it works for me after above fix applied ![]()
BR
Dimitar
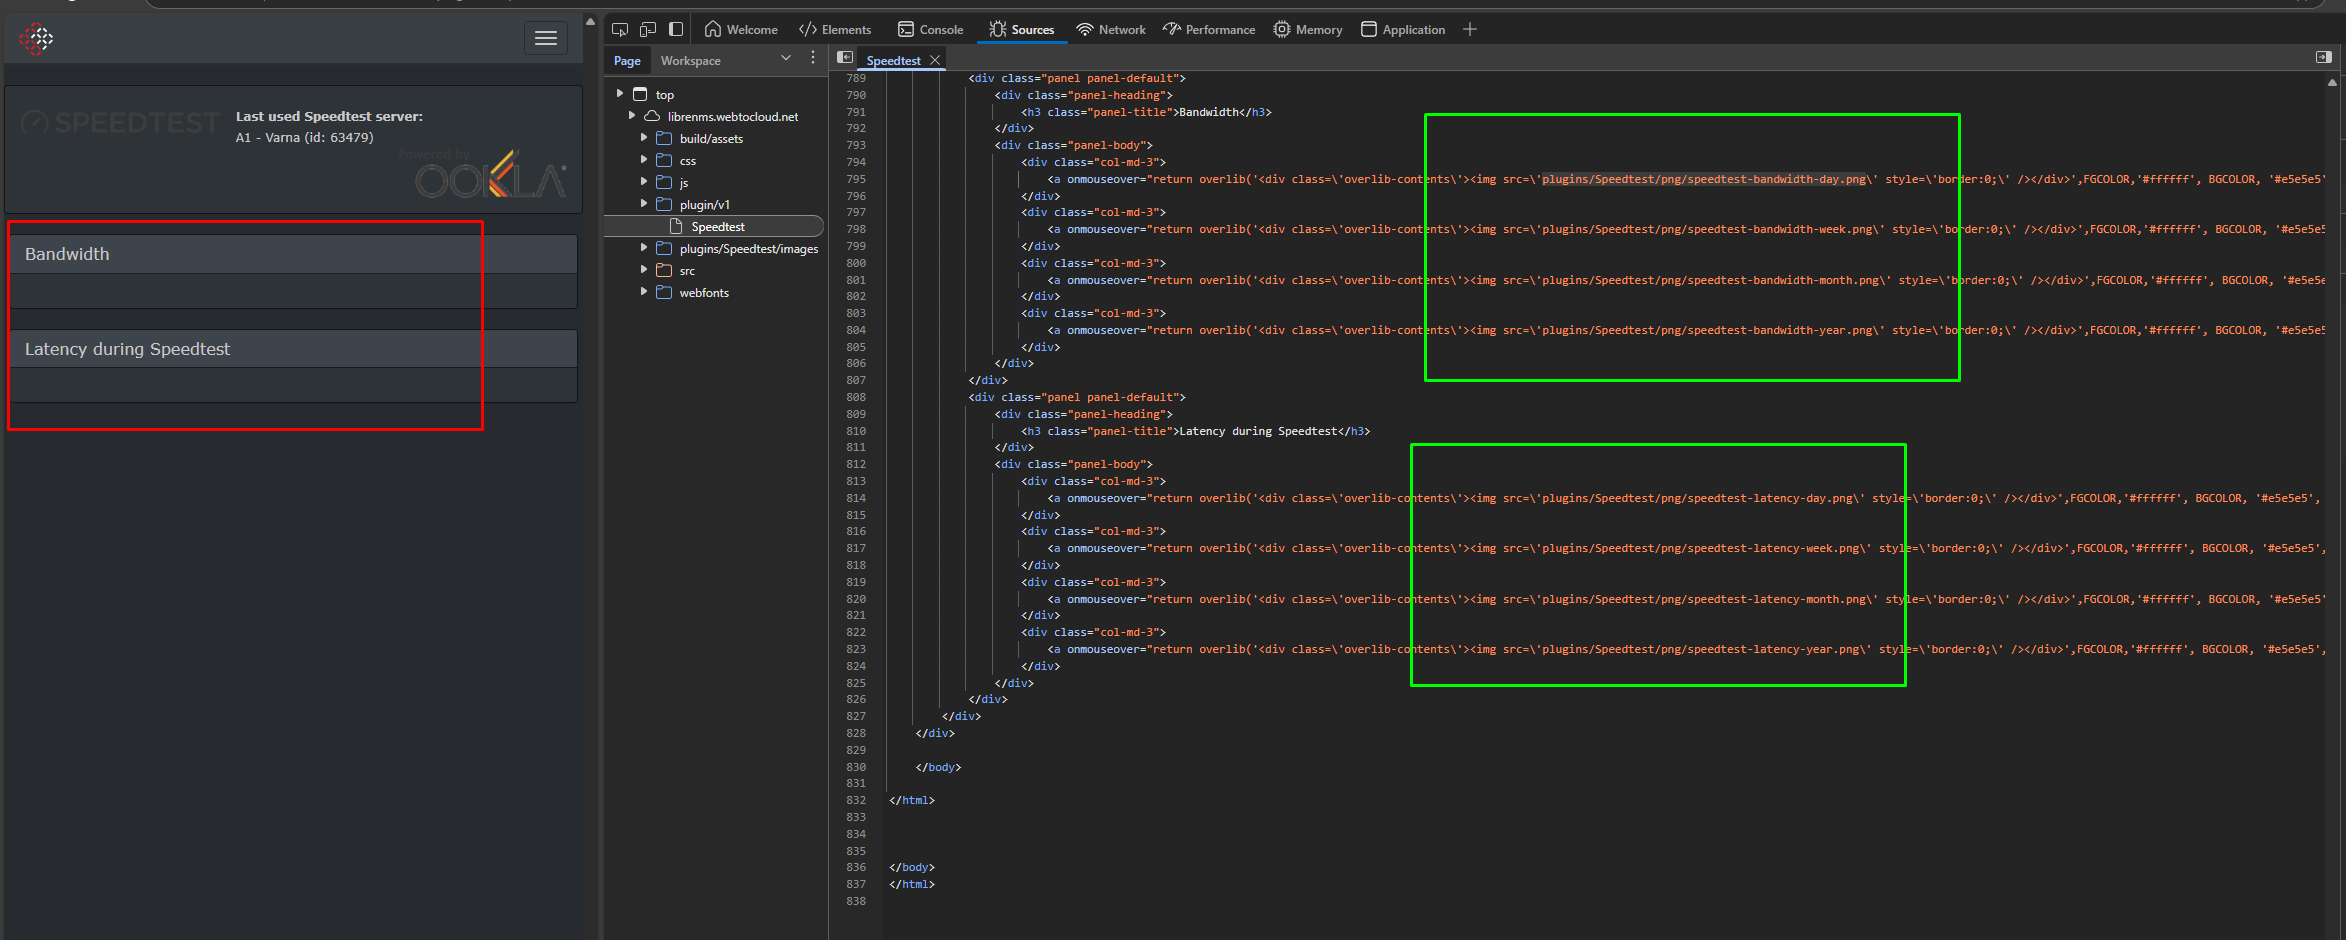
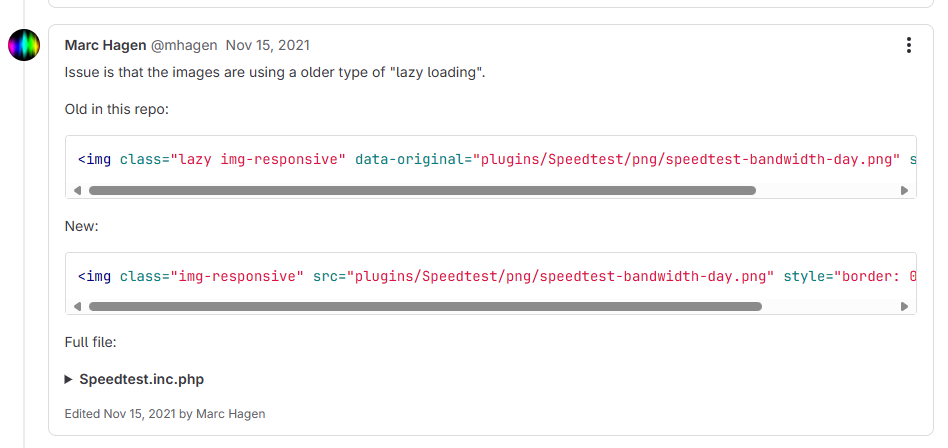
Hi,
It strange, that when I check source in github I can see this “lazy loadin” bug actually has been applied
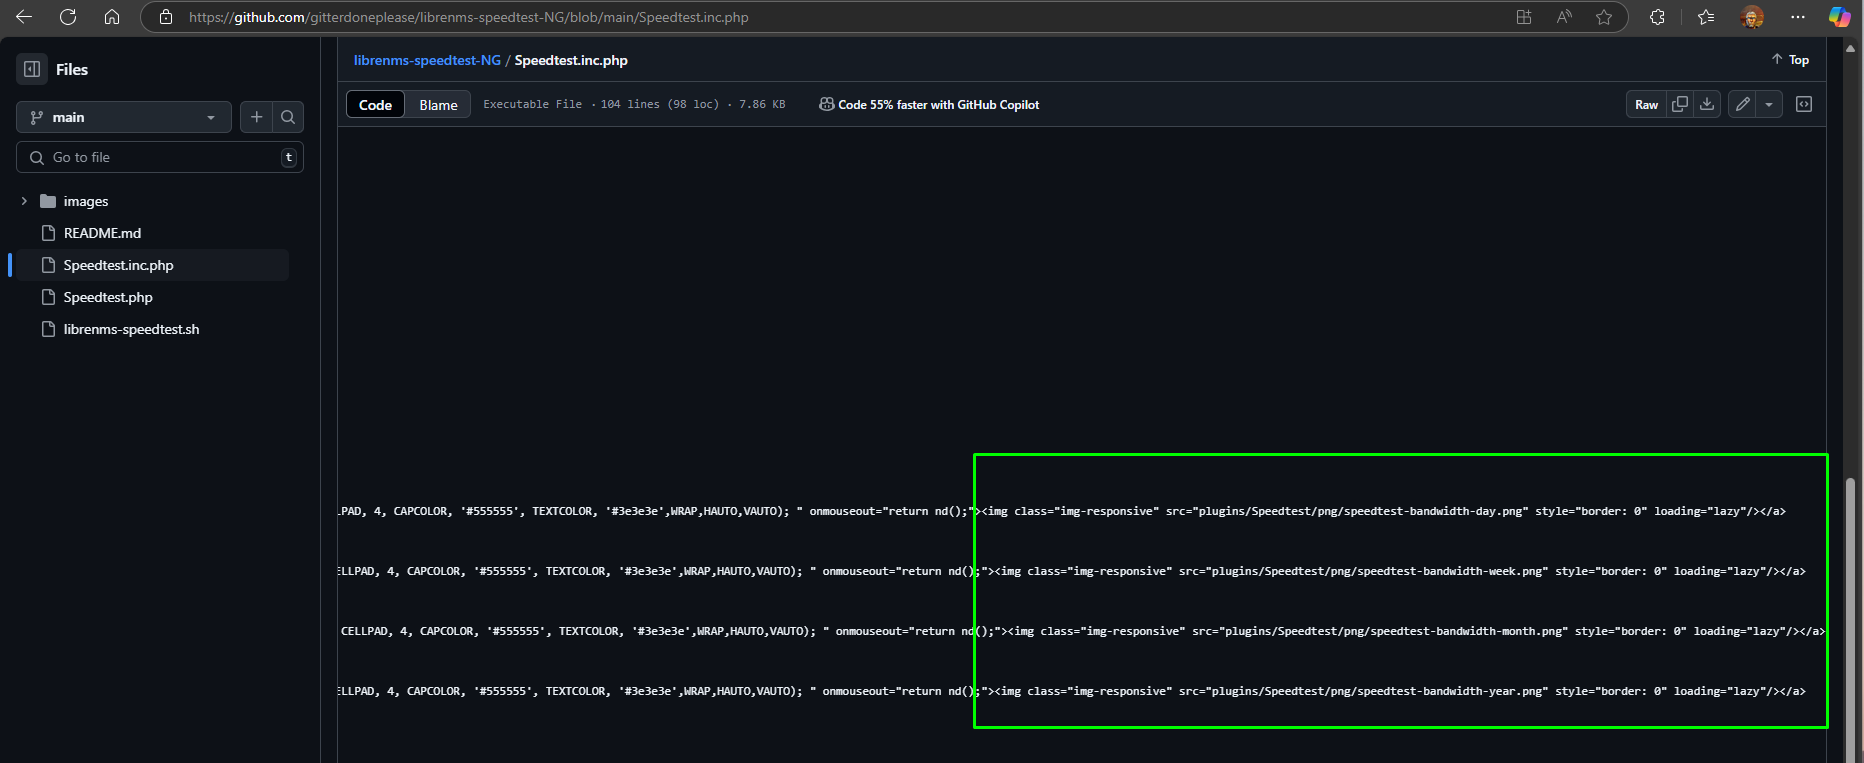
But when use git clone, as written in doc:
git clone Jack Greyhat / LibreNMS Speedtest · GitLab
Then I can see that bug fix hasn’t applied and have to fix it manually, so Speedtest plugin works, as expected!
BR
Dimitar