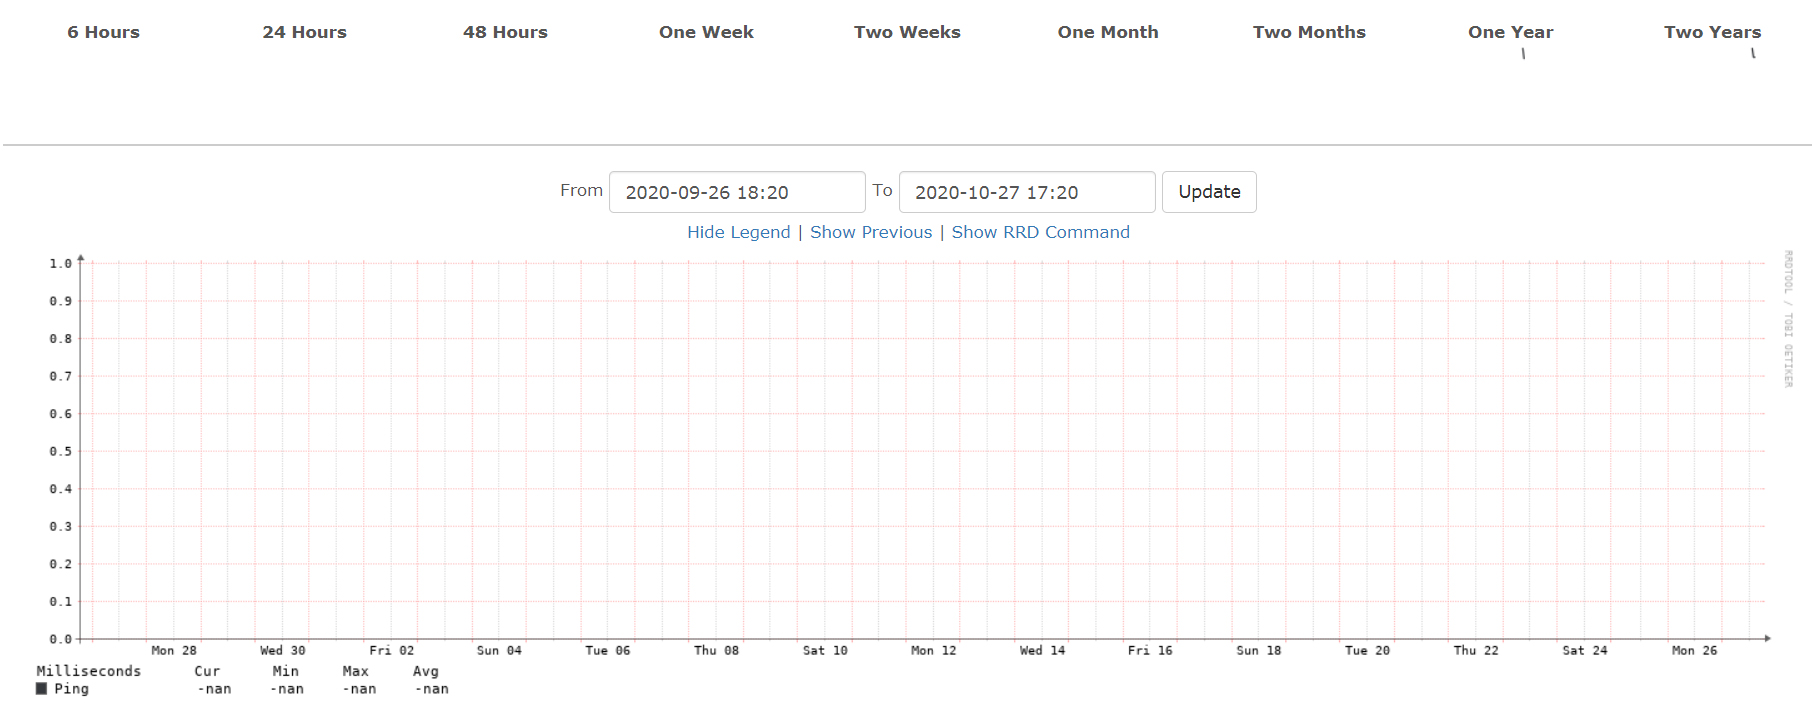
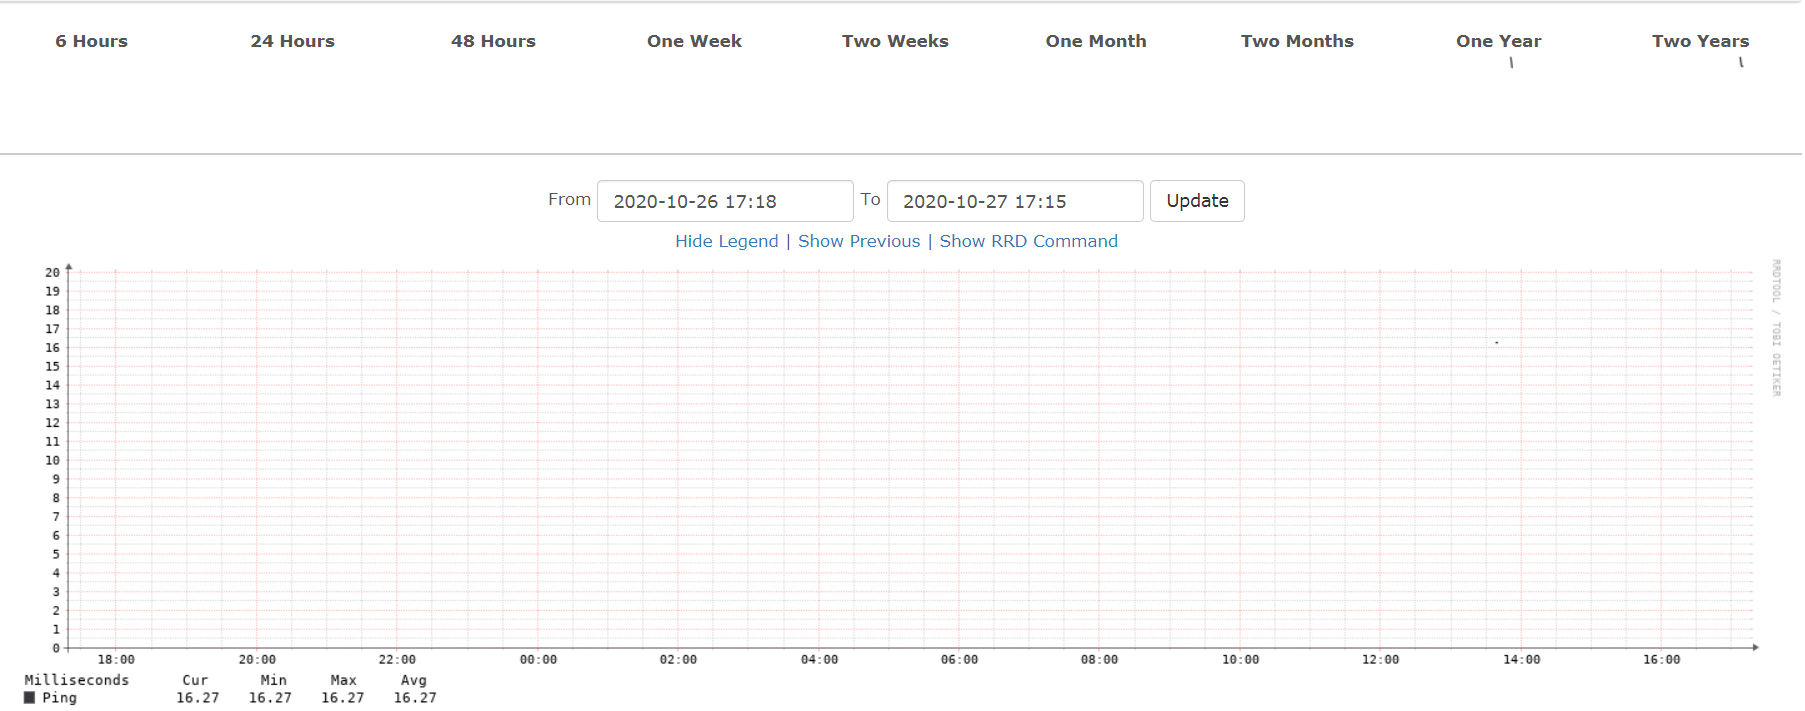
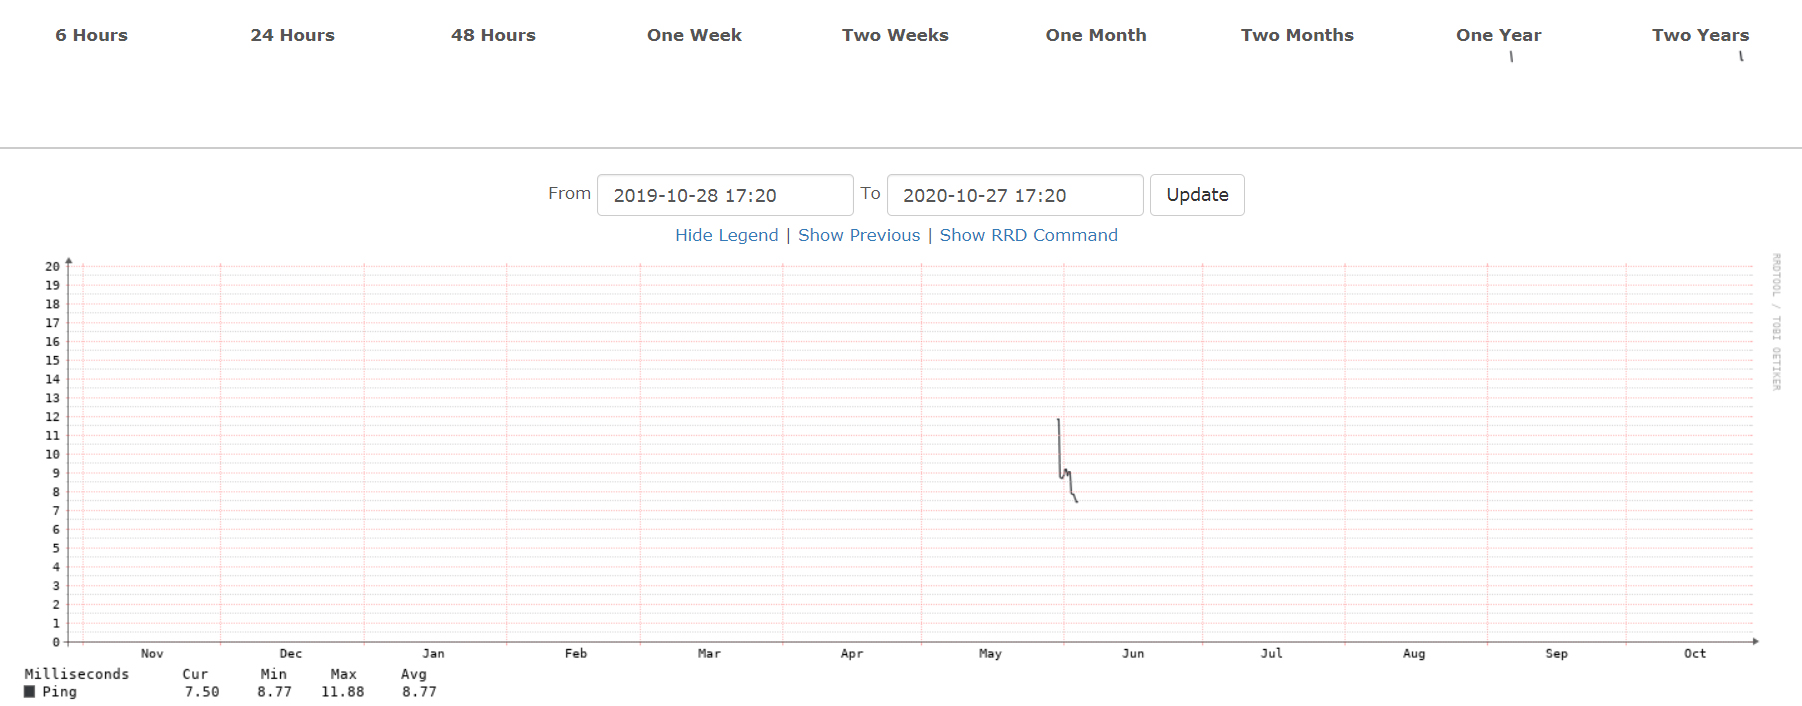
Hi I’ve been running the LibreNMS for six months now and it’s quite useful! But I’ve noticed a problem, I have some “only ping” devices and I wanted to see what the average delay is, because I needed to set up the ping rules to not be so strict for those devices. And when I looked at the ICMP Response Graph ( Ping Perf ) I’ve noticed that it’s pretty much empty. You can see that the “today” graph is also empty, but at least there are some values there. The one month graph shows no values what so ever and the 1 year graph shows some values from a short period of time.
I guess something has changed and broken the config, but I cant figure out what it could be.
I am pinging every 60 seconds as per config :
$config[‘ping_rrd_step’] = 60;
and the cron’s also edited :
- librenms /opt/librenms/ping.php >> /dev/null 2>&1
I clearly remember fixing the rrdp step when I configured the ping, but just to be sure I’ve issued the command one more time :
[root@librenms librenms]# systemctl stop rrdcached.service
[root@librenms librenms]# ./scripts/rrdstep.php -h all
Converted: 0  Failed: 0  Skipped: 4451
[root@librenms librenms]# systemctl start rrdcached.service
So what am I missing?