I have an issue the graph of an interface. Librenms not graphing the right interface.
The ifindex of the interface is correct.
The rdd port-id seems not to be the right.
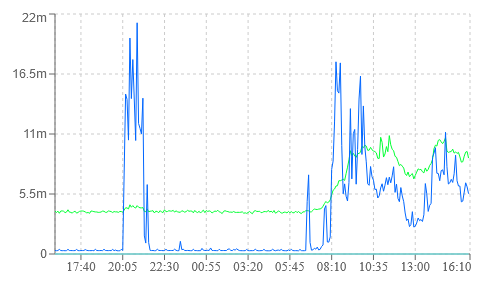
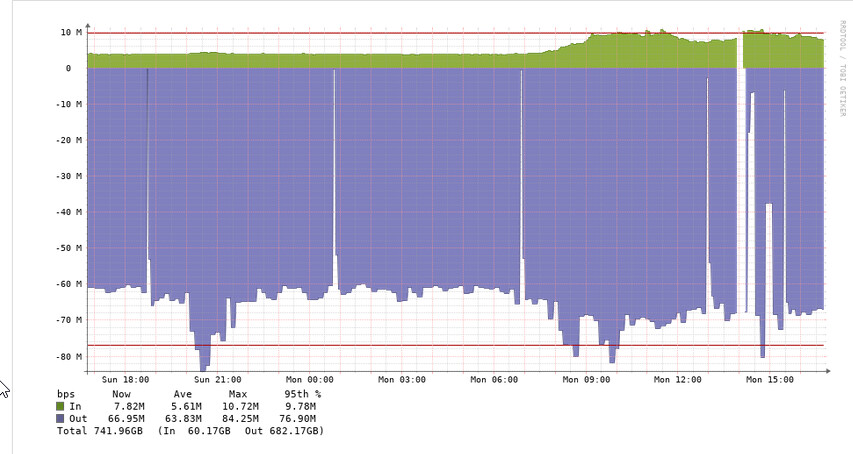
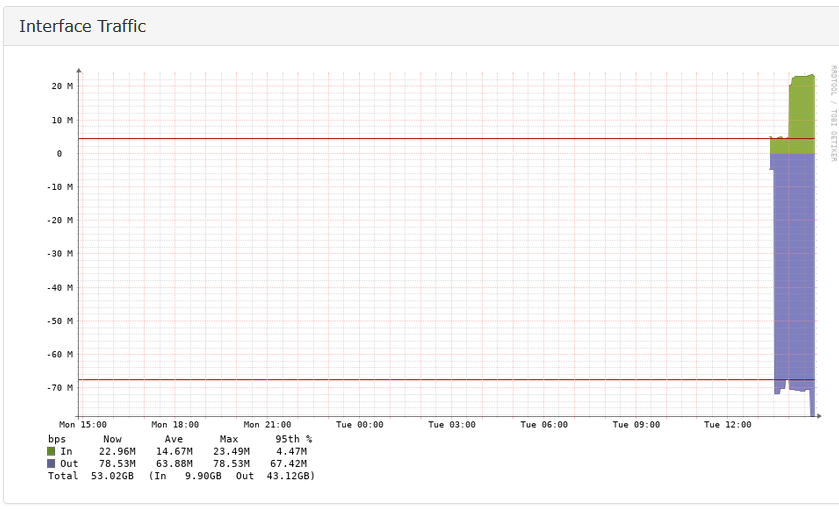
Below the right graph with Centreon and with LibreNMS
According the router statistics interface Centreon result is the right result.
It’s the only interface polled in this situation, the others one works well comparing with Centreon and interfaces statistics
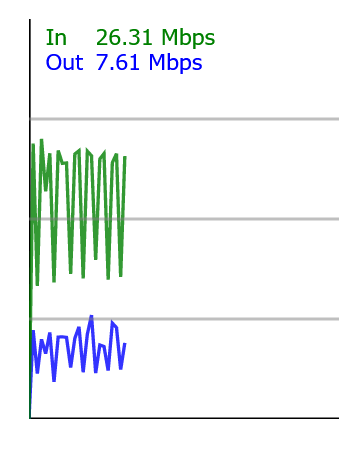
Moreover the real time graph seems to graph correctly.
How can I process to resolve this issue ?
The output of ./validate.php :
====================================
Component | Version
--------- | -------
LibreNMS | 21.1.0-11-g3d02e76e0
DB Schema | 2020_09_19_230114_add_foreign_keys_to_service_templates_device_table (197)
PHP | 7.4.12
Python | 3.7.3
MySQL | 10.3.25-MariaDB-0+deb10u1
RRDTool | 1.7.1
SNMP | NET-SNMP 5.7.3
====================================
Yes, the interface is correctly detected (ifSpeed":10000000000 and ifHighSpeed":10000). On an other interface where it’s works fin I have the same value. I have 30 subinterfaces, just one give wrong result.
The “ifOutOctets_rate” value is wrong for this interface.
How is calculated this variable ?
ifOutOctets_rate is not used for graphs or generated by graphs, just a simple calculation of bytes transferred per interval.
However, ifOutOctets itself is just stored. You should run the poller in debug mode and check the values returned by the device and saved to rrd. This could very likely be the case of a broken snmp implementation. Or maybe a bug in LibreNMS as the poller does try to handle a lot of device quirks.
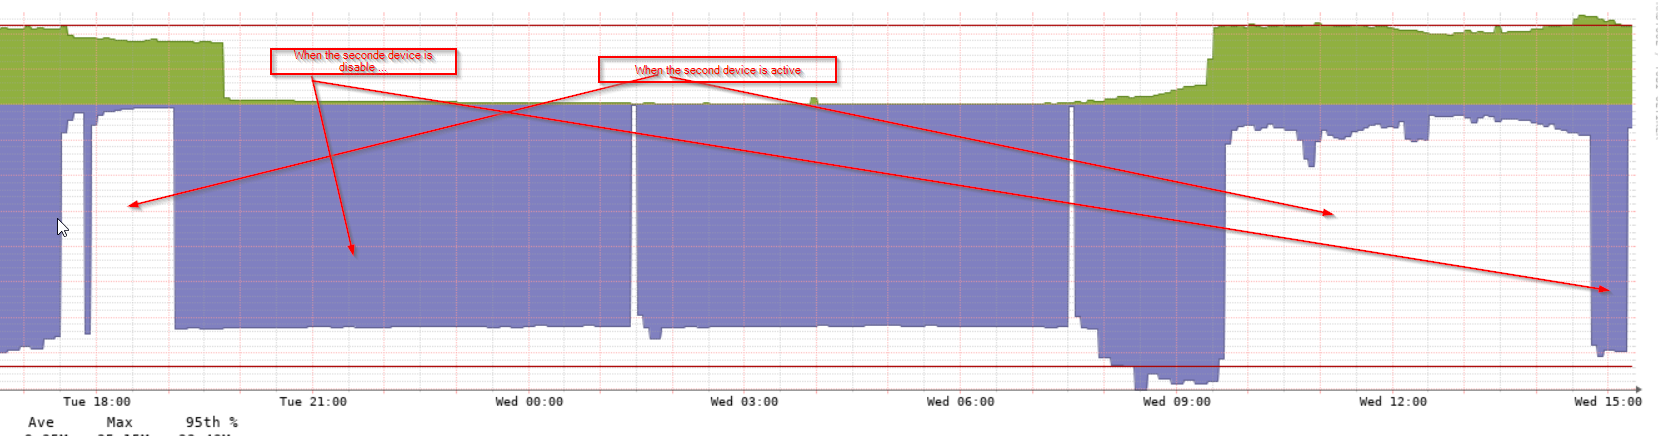
I created a duplicate same device. If the both are polled, the interfaces graph correctly. When I disable the polling of the new one created, the other interface get back wrong result … ?? What’s happening ?