What is the default time that LibreNMS pushes the data to InfluxDB? Is it possible to modify this? I have LibreNMS running on it’s own dedicated server with it pushing the InfluxDB data to another server that has InfluxDB installed as well as Grafana. It seems the data gets pushed there however, there seems to be a lapse in when the graphs update with relevant updated data, does this have to do with the polling on the LibreNMS server by chance? I definitely don’t want to change my polling times as they’re the default and I’m worried at this point I’m going to need to adjust those to a longer time since we’ve heavily populated the database with many objects being monitored.
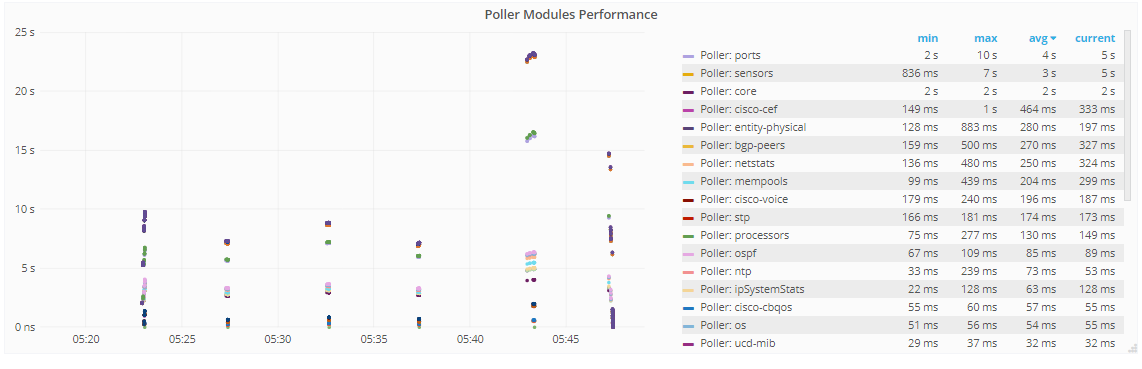
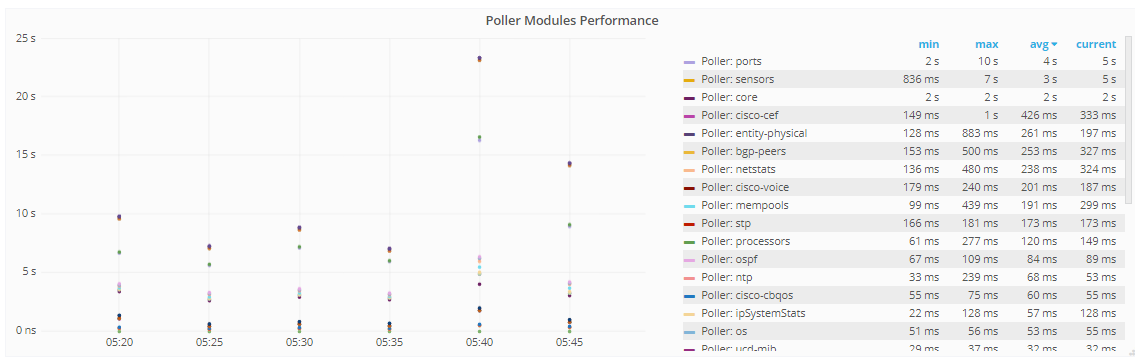
You may need to post a screenshot of what you’re seeing but it sounds like you’re using mostly LibreNMS defaults which should mean that the poller runs every 5 minutes and the data is sent over to external sources as the poller polls it. This means that the actual interval will vary slightly due to processing time which may cause issues depending on what you’re graphing and how you’re graphing it.
Example:
SELECT “poller” FROM “poller-perf” WHERE (“hostname” =~ /^$HOSTNAME$/ AND “module” != ‘ALL’) AND $timeFilter GROUP BY “module”
If you’re getting that far there are many ways you can go. It will kind of depend on how you’re using your data. You could just set null value to connected and do line charts. Or if the trends are more important (you don’t mind data points being aggregated and shifted by a couple minutes) you might set the min interval to >5m and group the data by the interval to get your points at exact 5m intervals. Then you could easily use line, bar or staircase charts.
SELECT mean(“poller”) FROM “poller-perf” WHERE (“hostname” =~ /^$HOSTNAME$/ AND “module” != ‘ALL’) AND $timeFilter GROUP BY time($__interval), “module”
1 Like