Hi!
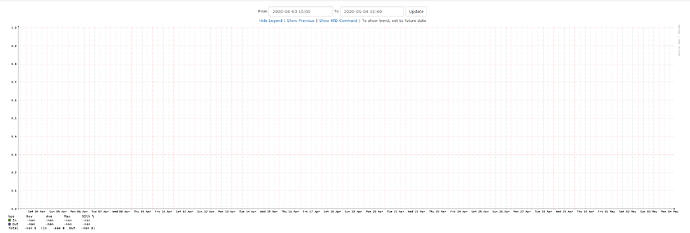
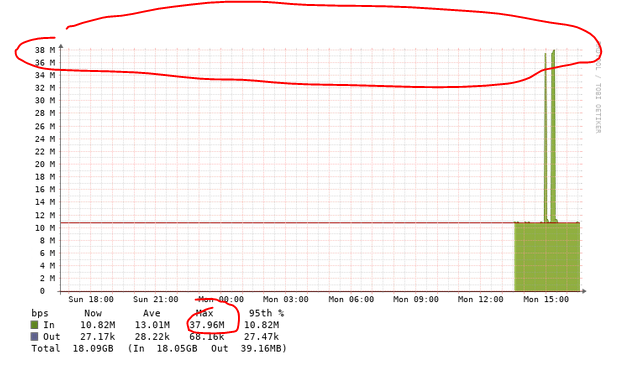
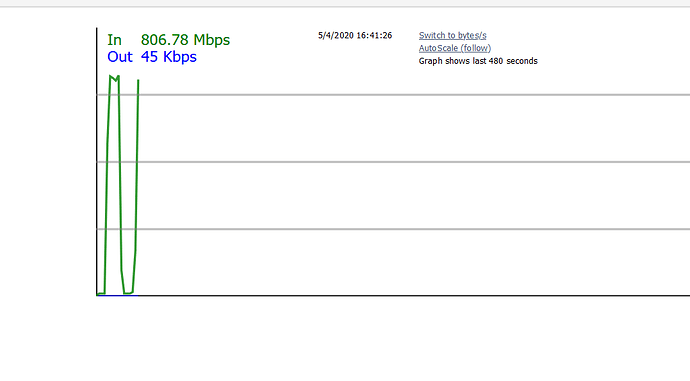
I want to graph the ports of my Aruba, Firewall and Dlink switches to check their interface usage/bandwidth. I have start with DLink switch but the bps graph is not showing any data.
I am using snmpv2. Its an 1G graph.
./validate.php
| Component | Version |
|---|---|
| LibreNMS | 1.63-27-ge7b371e1c |
| DB Schema | 2020_04_19_010532_eventlog_sensor_reference_cleanup (164) |
| PHP | 7.2.30-1+ubuntu18.04.1+deb.sury.org+1 |
| MySQL | 10.1.44-MariaDB-0ubuntu0.18.04.1 |
| RRDTool | 1.7.0 |
| SNMP | NET-SNMP 5.7.3 |
| ==================================== |
[OK] Composer Version: 1.10.5
[OK] Dependencies up-to-date.
[OK] Database connection successful
[OK] Database schema correct
I did run tune as well for testing purpose but still the same.
Tuning port 1/16…
Tuning port 1/17…
Tuning port 1/18…
Tuning port 1/19…
Tuning port 1/20…
Tuning port 1/21…
Tuning port 1/22…
Tuning port 1/23…
Tuning port 1/24…
Tuning port 1/25…
How can fix this?
Thanks


