Can someone please explain what the “u”, “m”, and “B” stand for?
I have been searching for an answer and cannot find anything.
Can someone please explain what the “u”, “m”, and “B” stand for?
I have been searching for an answer and cannot find anything.
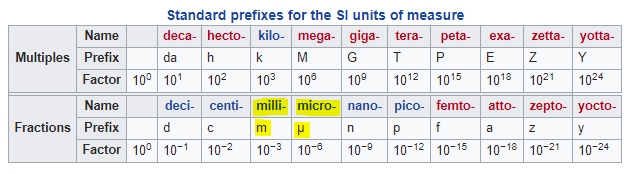
m=Milli
μ=Micro
The scaling comes from rrdtool, the graph uses prefixes from the International System of Units (SI Units)
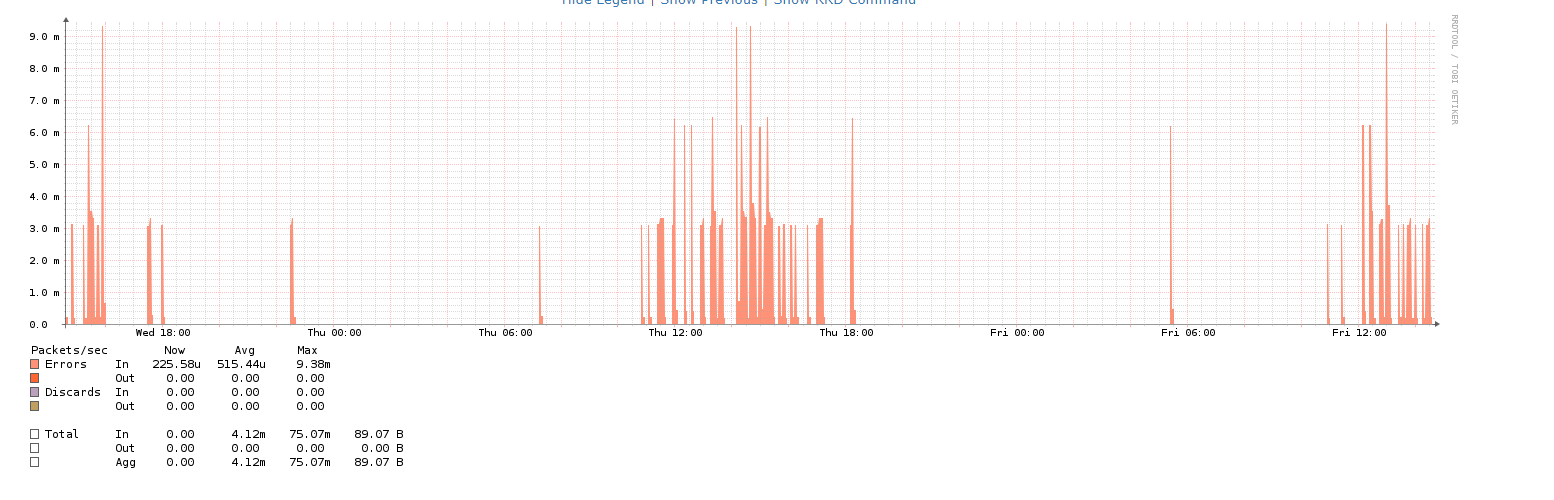
For your Errors/Sec graph:
515.44μ is micro (10^-6), so 515.44 / 1000000 = 0.000515 Errors/Sec
4.12m is milli (10^-3), so 4.12 / 1000 = 0.00412 Errors/Sec
For example, if your polling interval is 5 minutes (300s) then your average of 4.12m is really:
0.00412 x 300 = Just over 1 Error each poll.
Looking at rrdtool it’s possible not to scale the y-axis of the graph, not sure if this is configurable in librenms yet.
B is just the total Bytes aggregate (Not related to the graph really.)
Appreciate it!
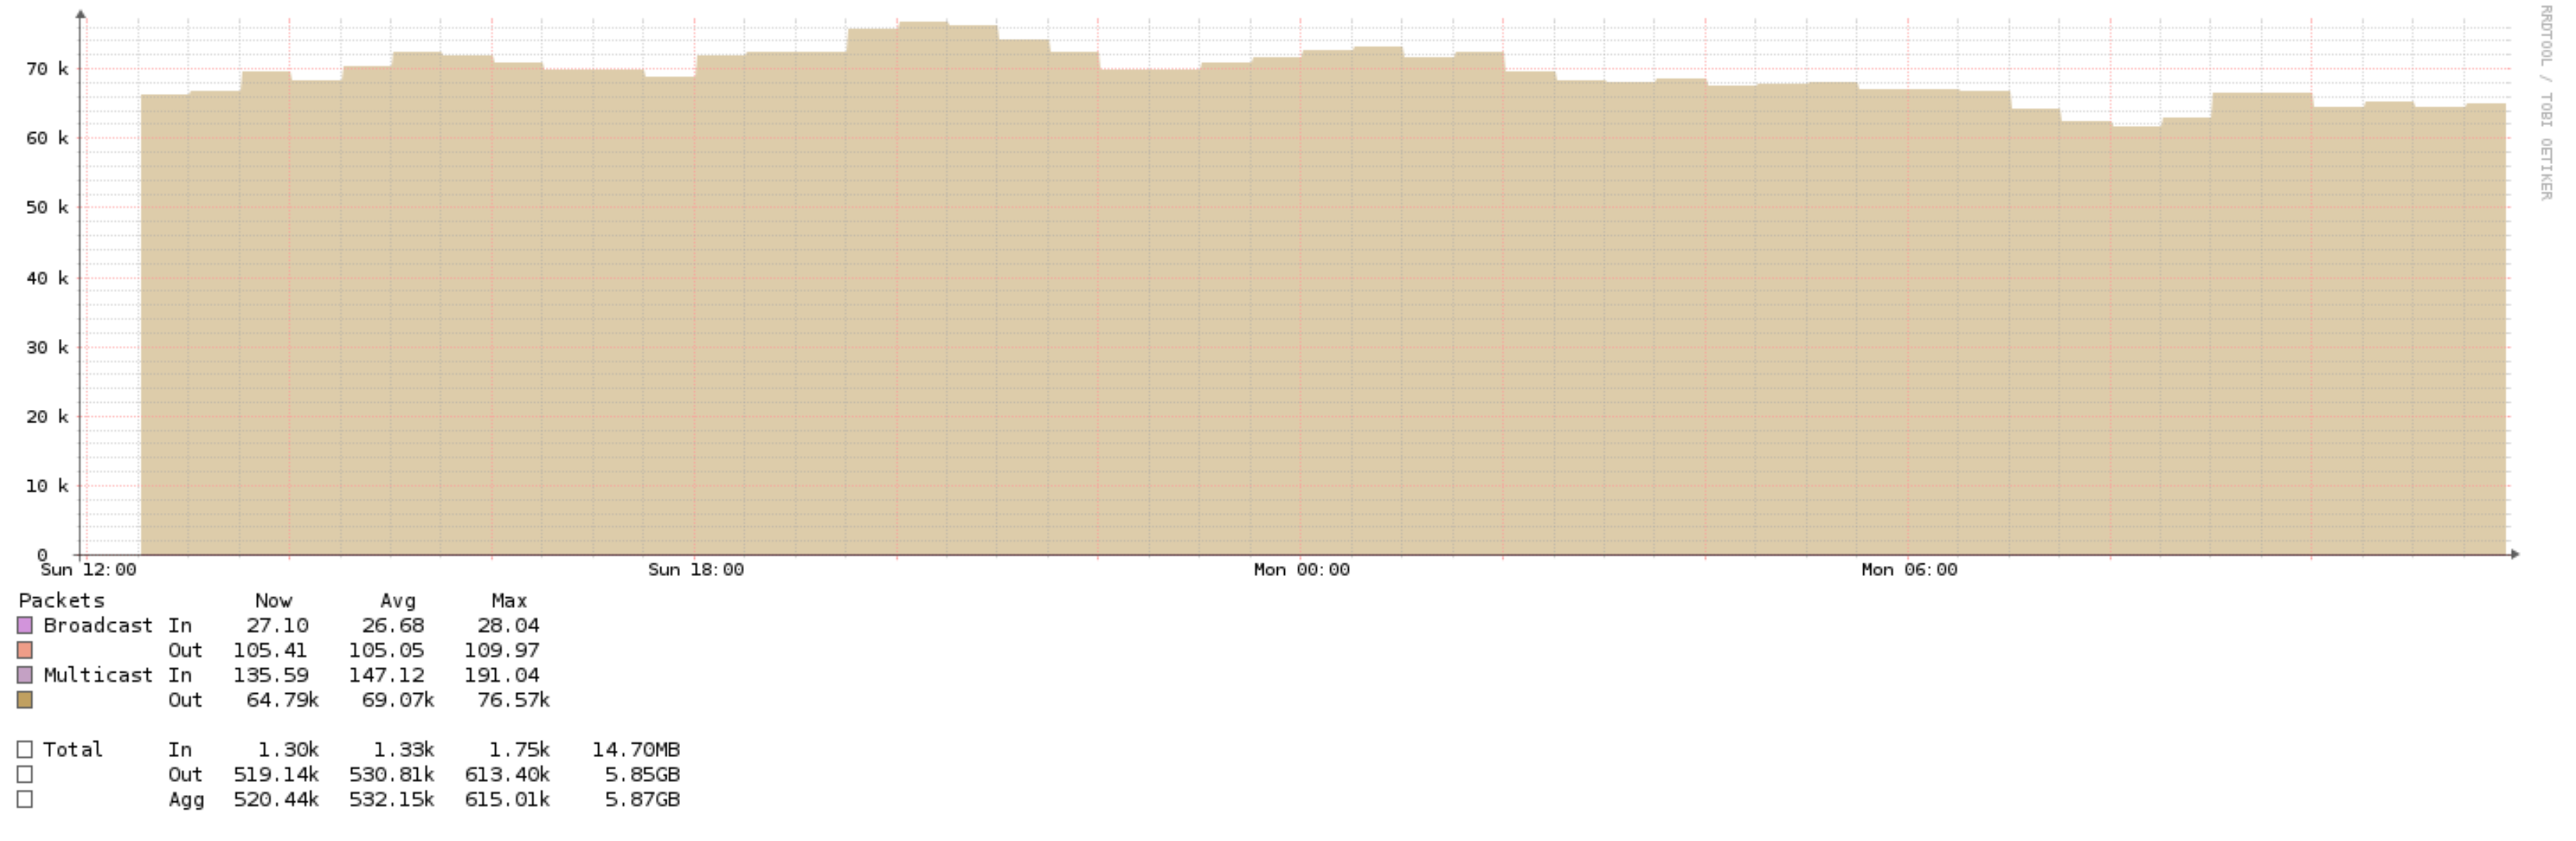
I am attaching another graph. Would you mind to tell me if there is anything special to it?
I think in this case, k is thousand, which also follows SI units k=10^3
so 69k = 69,000 multicast packets out / Sec
This is incorrect. I did a clear counters on my device and I see a couple random link local multicasts added to the counters every once in a while. Wireshark shows the same.
The graphs are showing thousands and millions of “packets per second”. I think this is somehow trying to graph packets total… but that would not be that good for trend analysis. There can literally be devices sending several thousand PPS of video or other types of multicast packet.