Hello,
I have a redistributed system that I have some odd problems with.
Some machines are polling flawlessly independent where it’s placed. Some are not that flawlessly.
I have alot of gaps in some graphs (always same device) independent in what poller-group i put it in.
The pollers arent reporting any problem with reaching the device and it always works when I manually do the polling.
I’ve tried removing all devices and just use the standard setup, without any changes. Today i added about 500 devices that graph (49k ports working maybe about 500 ports that have holes) just as it should do, but this device that were added in the beginning doesnt graph.
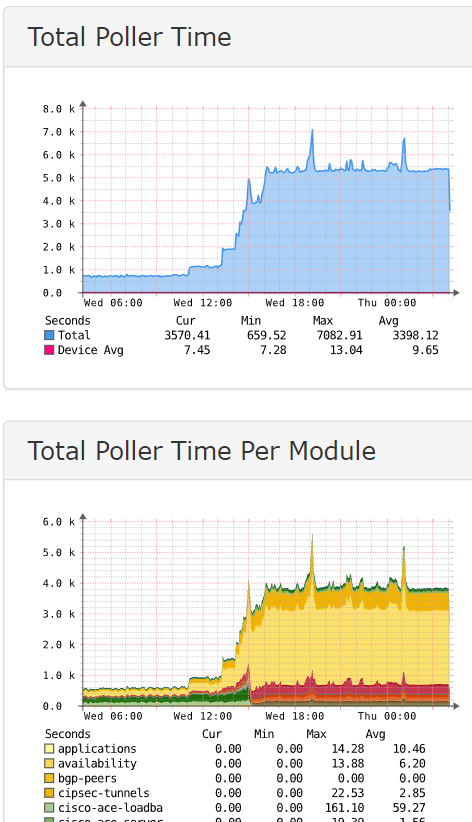
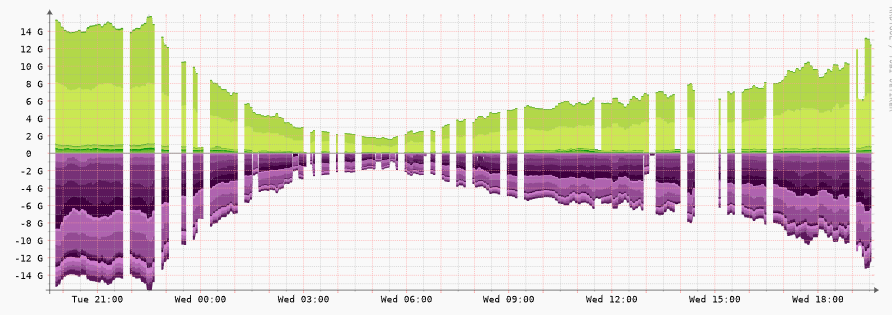
Portsgraph
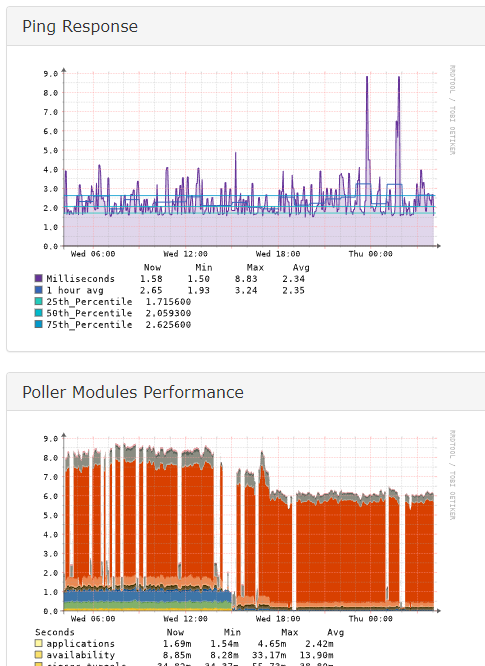
CPU graph
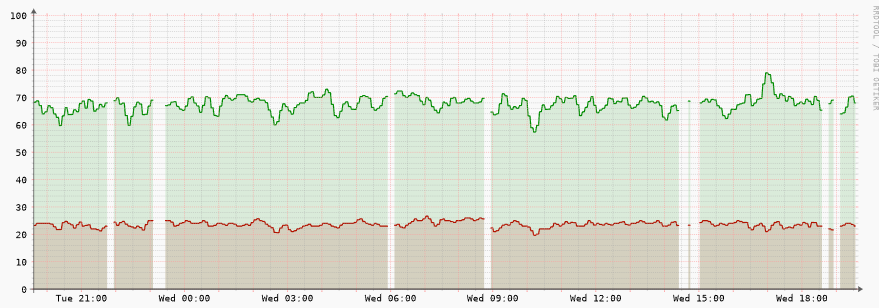
As images show its not really conclusive that it is a reachablitity issue, but rather a response/graph-issue?
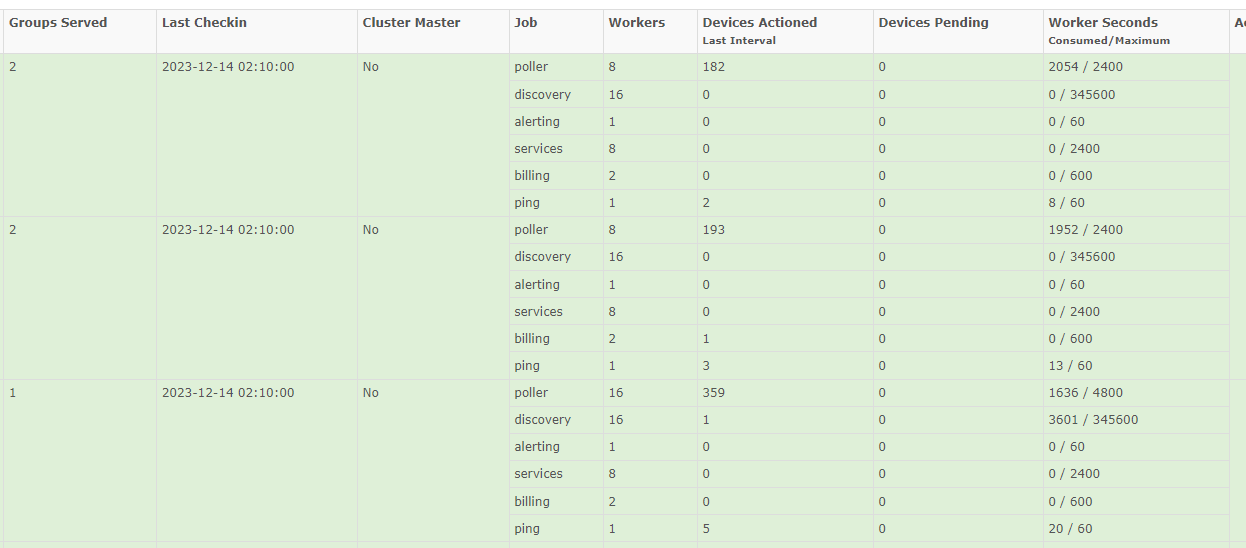
Right now i use 2 pollers in this group with dispatcher service.
All machines are placed on NVME servers with very load.
MariaDB: 0.23, 0.32, 0.35
RRDcached: 0.34, 0.29, 0.21
Web/Cluster Master: 0.00, 0.02, 0.03
I have no strange lines in journal on either machine.
Anyone having any idea of what can cause this?
Anyone having any idea of how i can resolve this or lead me in a way I can troubleshoot it?
The odd thing for me is that the new devices doesnt have this issue, only the first ones. As I wrote this post i actually removed one of the troubled devices, removed the RRD’s and added the device again, to see if it could be a creation problem from the beginning.
All systems are up to date as below and the issue has been since i newly installed it 2 weeks ago.
===========================================
| Component | Version |
|---|---|
| LibreNMS | 23.11.0-28-ge77a9ccf8 (2023-12-13T11:08:42+01:00) |
| DB Schema | 2023_11_21_172239_increase_vminfo.vmwvmguestos_column_length (274) |
| PHP | 8.1.2-1ubuntu2.14 |
| Python | 3.10.12 |
| Database | MariaDB 10.6.12-MariaDB-0ubuntu0.22.04.1 |
| RRDTool | 1.7.2 |
| SNMP | 5.9.1 |
| =========================================== |
[OK] Composer Version: 2.6.6
[OK] Dependencies up-to-date.
[OK] Database connection successful
[OK] Database Schema is current
[OK] SQL Server meets minimum requirements
[OK] lower_case_table_names is enabled
[OK] MySQL engine is optimal
[OK] Database and column collations are correct
[OK] Database schema correct
[OK] MySQl and PHP time match
[OK] Distributed Polling setting is enabled globally
[OK] Connected to rrdcached
[OK] Active pollers found
[OK] Dispatcher Service is enabled
[OK] Locks are functional
[OK] Python wrapper cron entry is not present
[OK] Redis is functional
[OK] rrdtool version ok
[OK] Connected to rrdcached