Hi,
I am having little difficulties understanding the interface errors graphs:
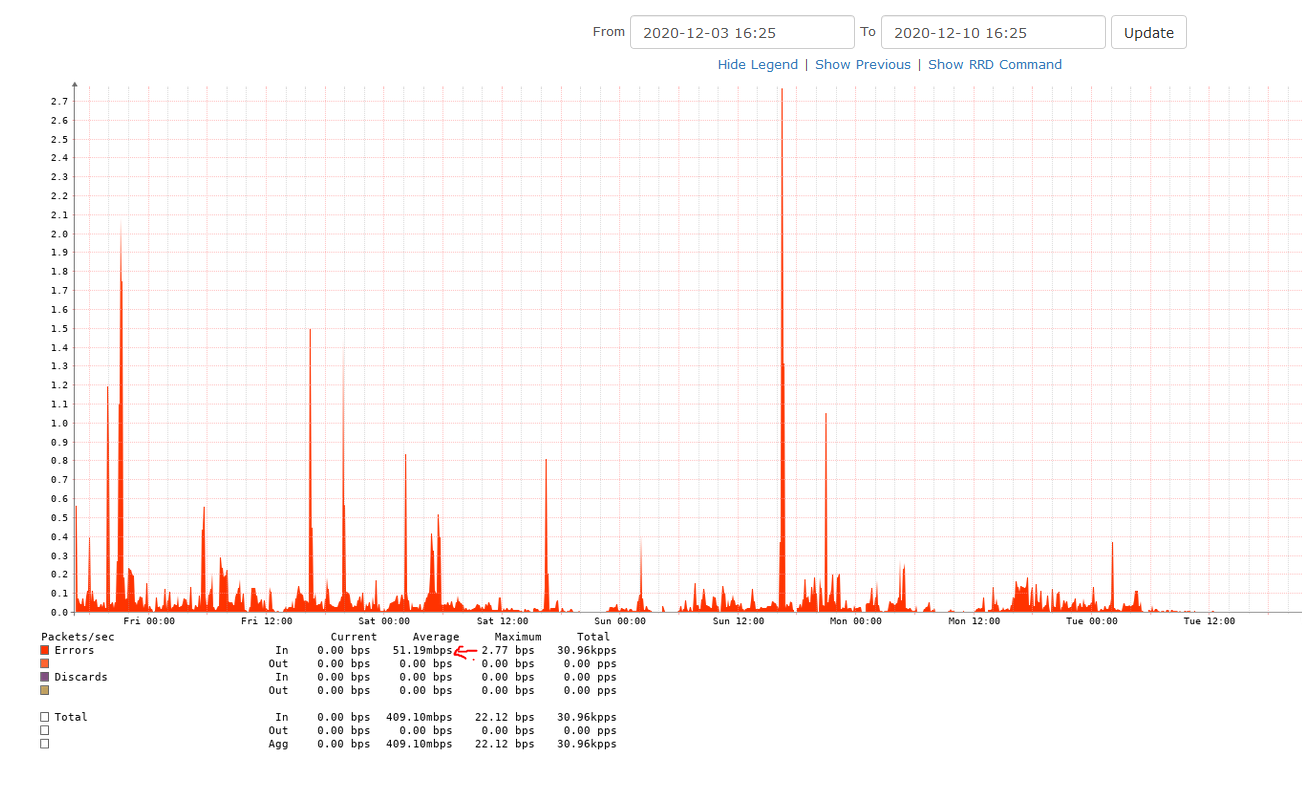
- The average value seems to be higher than than maximum value - is this a rounding / conversion issue?
- How should these values be interpreted?
- Is the graphed value just the delta count from the previous counter divided by the graph’s interval?
See this example figure from a 100 Gbit/s interface from a Cisco Nexus C9364C device (Cisco NX-OS)
====================================
| Component | Version |
|---|---|
| LibreNMS | 1.69-69-g0a7586b9f |
| DB Schema | 2020_10_12_095504_mempools_add_oids (191) |
| PHP | 7.4.3 |
| Python | 3.8.5 |
| MySQL | 10.3.25-MariaDB-0ubuntu0.20.04.1 |
| RRDTool | 1.7.2 |
| SNMP | NET-SNMP 5.8 |
| OpenSSL | |
| ==================================== |
[OK] Composer Version: 2.0.8
[OK] Dependencies up-to-date.
[OK] Database connection successful
[OK] Database schema correct
[INFO] Detected Python Wrapper
[OK] Connection to memcached is ok
[WARN] Global lnms shortcut not installed. lnms command must be run with full path
[FIX]:
sudo ln -s /opt/librenms/lnms /usr/local/bin/lnms
[WARN] Bash completion not installed. lnms command tab completion unavailable.
[FIX]:
sudo cp /opt/librenms/misc/lnms-completion.bash /etc/bash_completion.d/
[WARN] Your install is over 24 hours out of date, last update: Tue, 01 Dec 2020 07:45:53 +0000
[FIX]:
Make sure your daily.sh cron is running and run ./daily.sh by hand to see if there are any errors.