I have configured UDP VOIP jitter sla on our cisco router. Below is output of statistics on the router:
#show ip sla statistics 10
IPSLAs Latest Operation Statistics
IPSLA operation id: 10
Type of operation: udp-jitter
Latest RTT: 54 milliseconds
Latest operation start time: 10:35:16 UTC Mon Aug 3 2020
Latest operation return code: OK
RTT Values:
Number Of RTT: 1000 RTT Min/Avg/Max: 54/54/57 milliseconds
Latency one-way time:
Number of Latency one-way Samples: 0
Source to Destination Latency one way Min/Avg/Max: 0/0/0 milliseconds
Destination to Source Latency one way Min/Avg/Max: 0/0/0 milliseconds
Jitter Time:
Number of SD Jitter Samples: 999
Number of DS Jitter Samples: 999
Source to Destination Jitter Min/Avg/Max: 0/1/3 milliseconds
Destination to Source Jitter Min/Avg/Max: 0/1/1 milliseconds
Over Threshold:
Number Of RTT Over Threshold: 0 (0%)
Packet Loss Values:
Loss Source to Destination: 0
Source to Destination Loss Periods Number: 0
Source to Destination Loss Period Length Min/Max: 0/0
Source to Destination Inter Loss Period Length Min/Max: 0/0
Loss Destination to Source: 0
Destination to Source Loss Periods Number: 0
Destination to Source Loss Period Length Min/Max: 0/0
Destination to Source Inter Loss Period Length Min/Max: 0/0
Out Of Sequence: 0 Tail Drop: 0
Packet Late Arrival: 0 Packet Skipped: 0
Voice Score Values:
Calculated Planning Impairment Factor (ICPIF): 1
MOS score: 4.34
Number of successes: 19
Number of failures: 0
Operation time to live: Forever
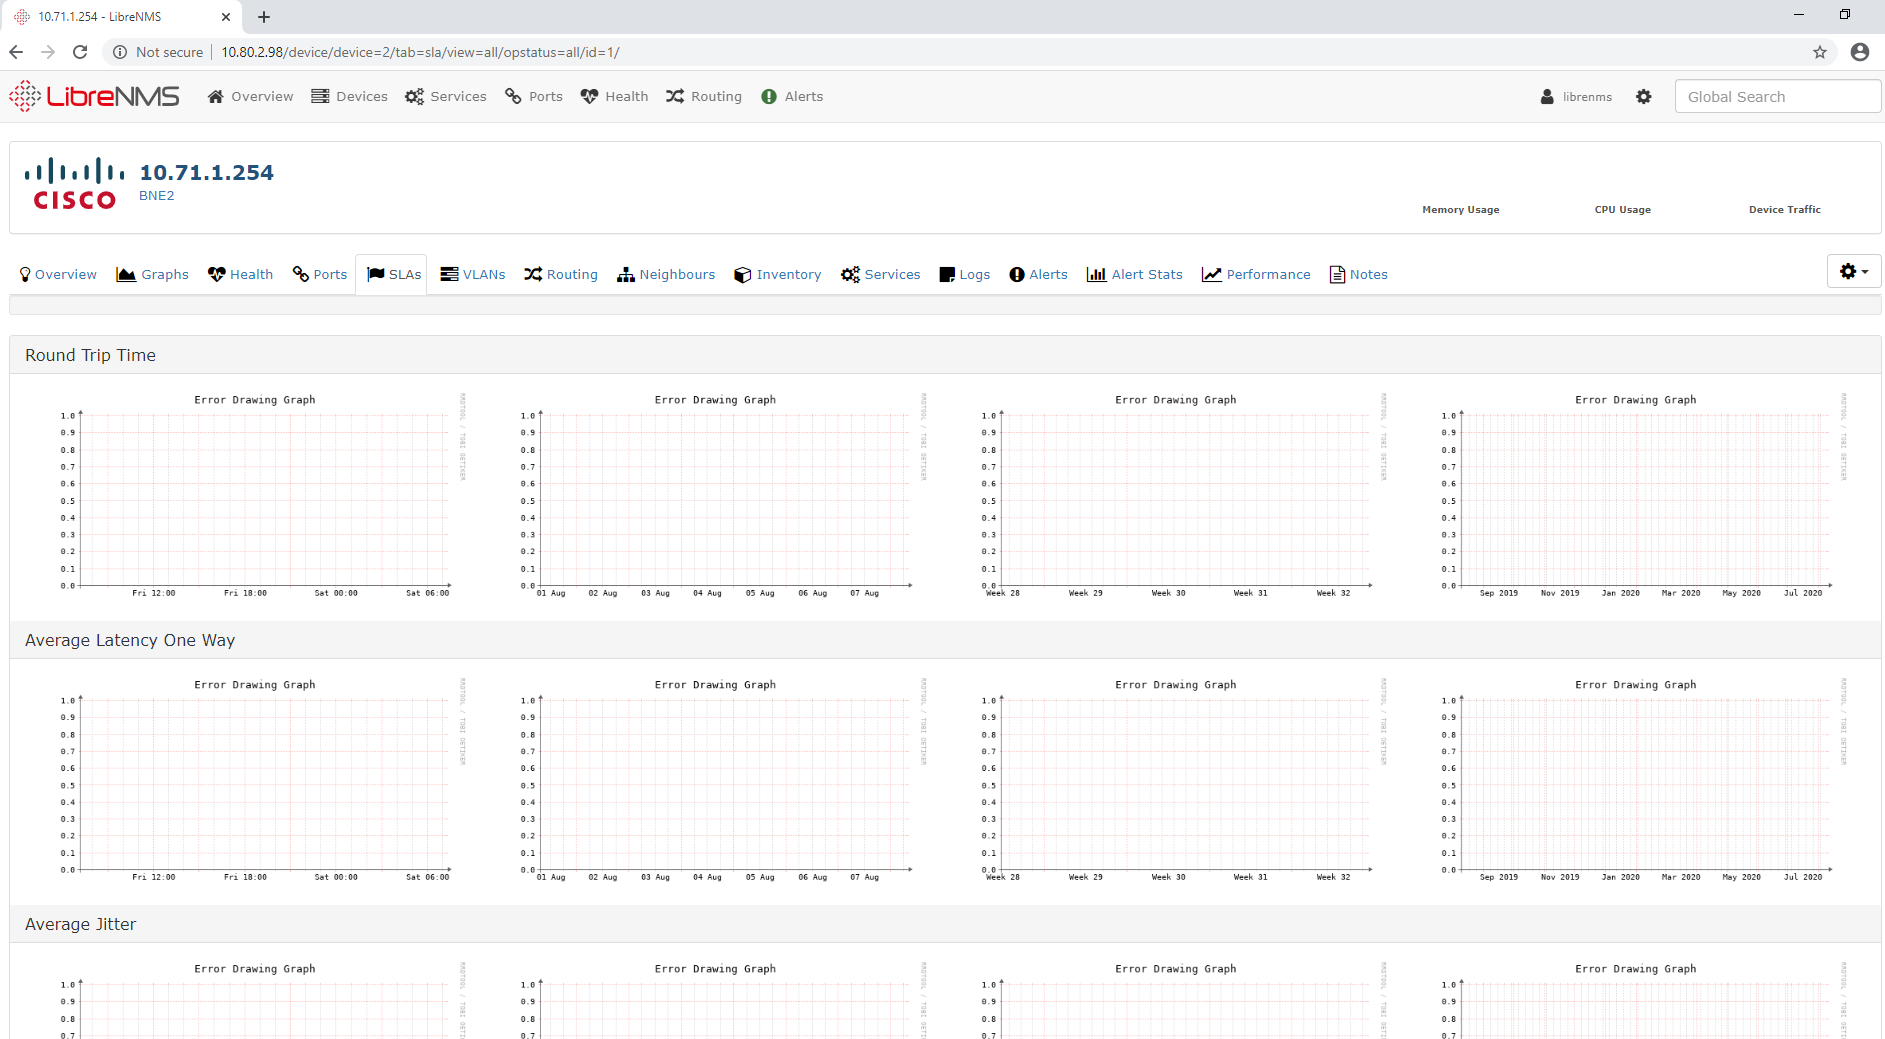
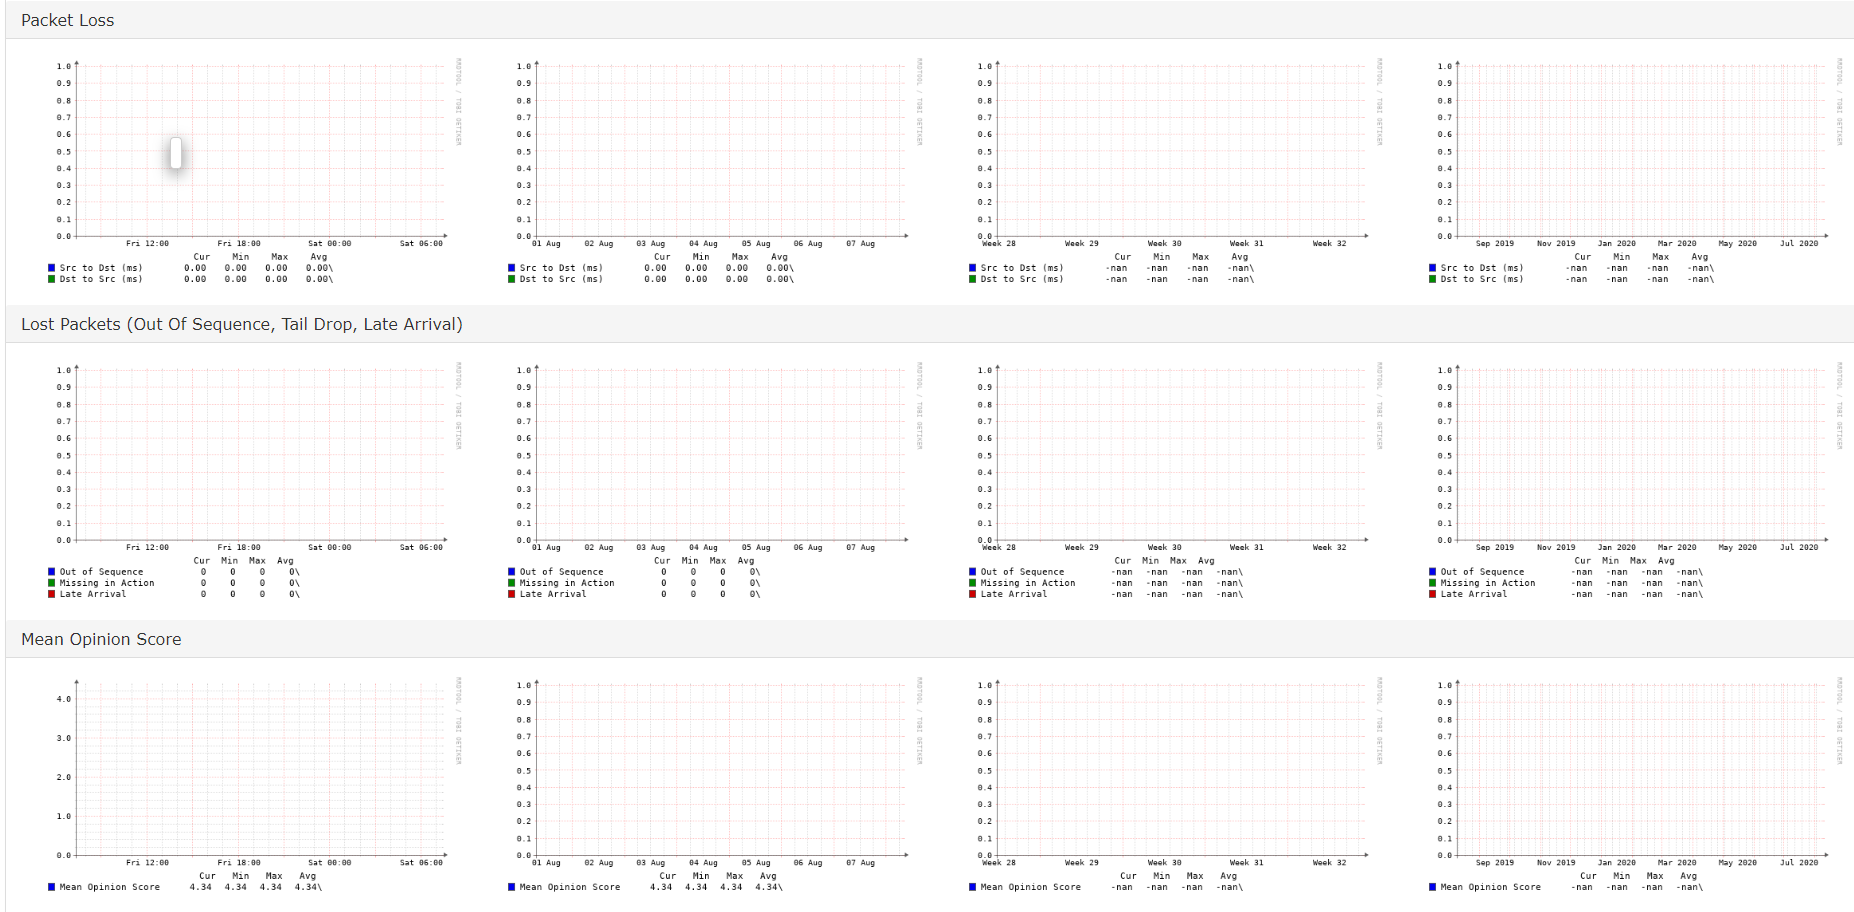
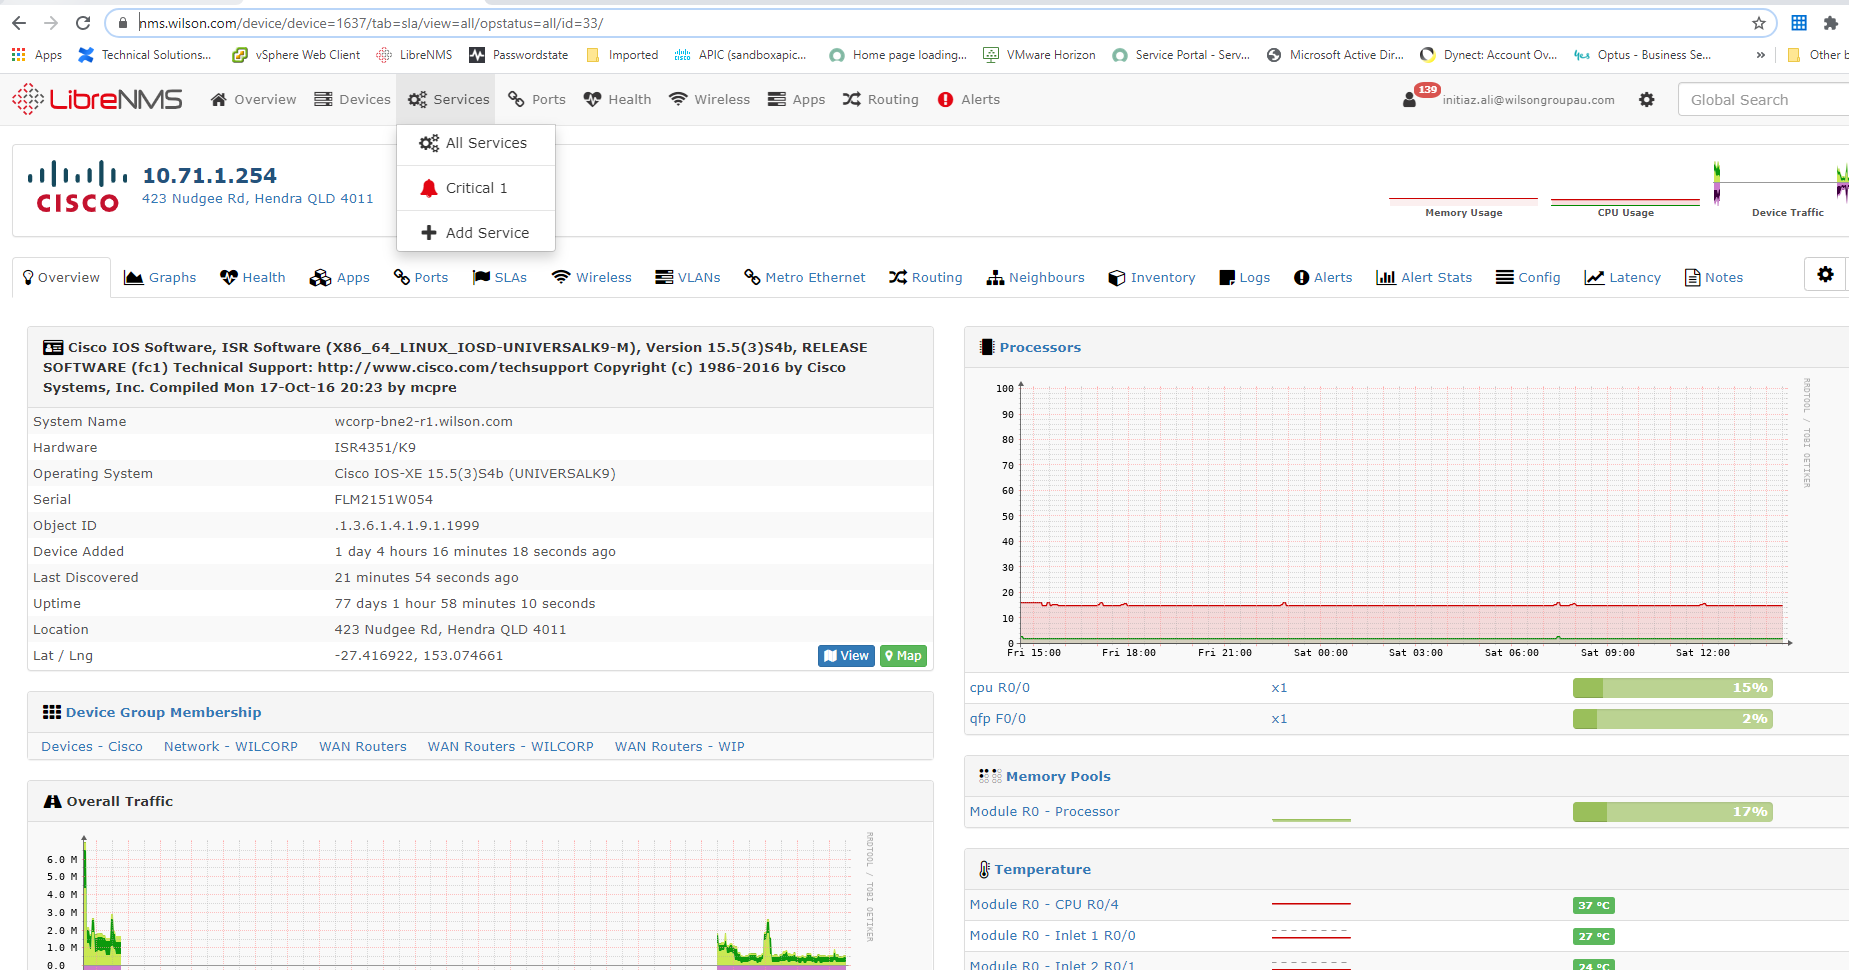
I would like LibreNMS to show the Voice Score Values: ICPIF and MOS values.
Our LibreNMS is set to auto download updates however I cant still see this details.
Would highly appreciate resolving this.
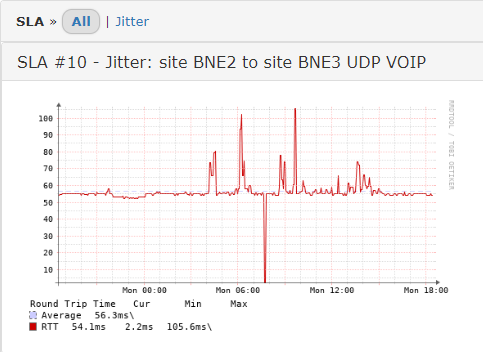
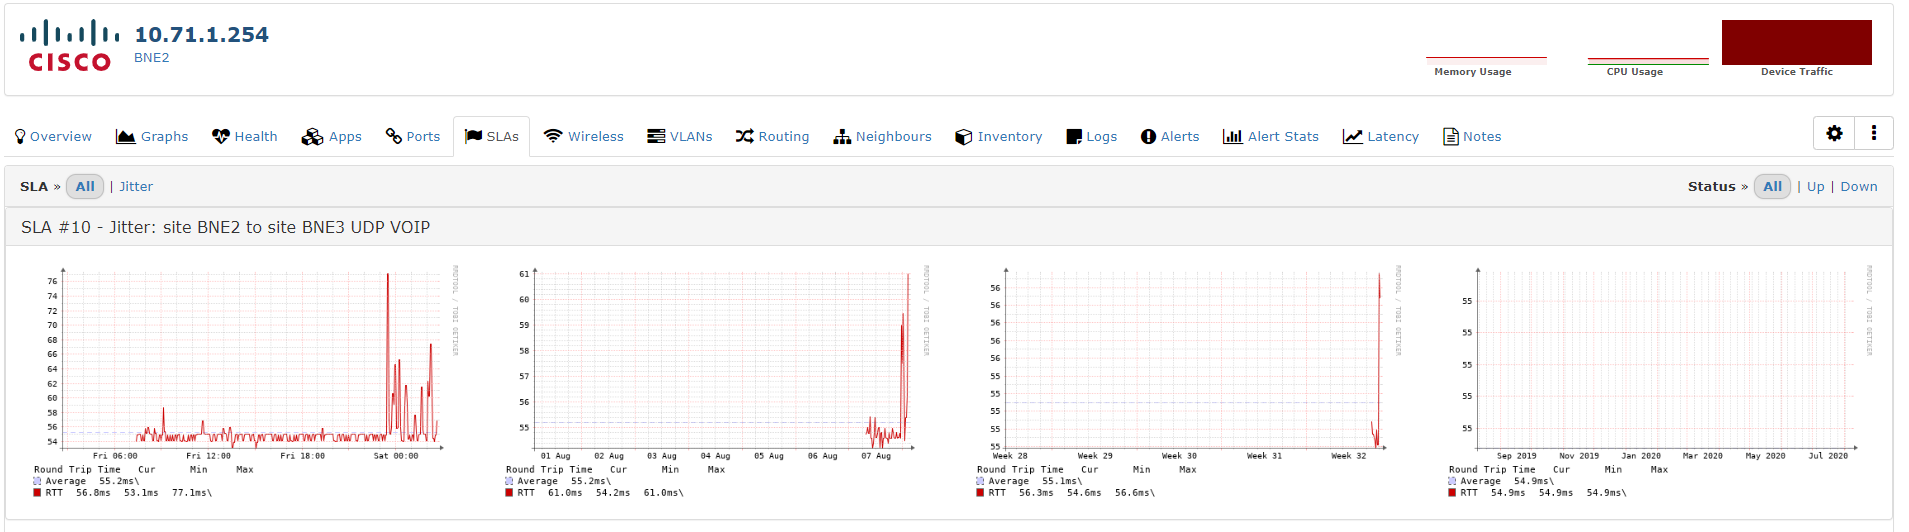
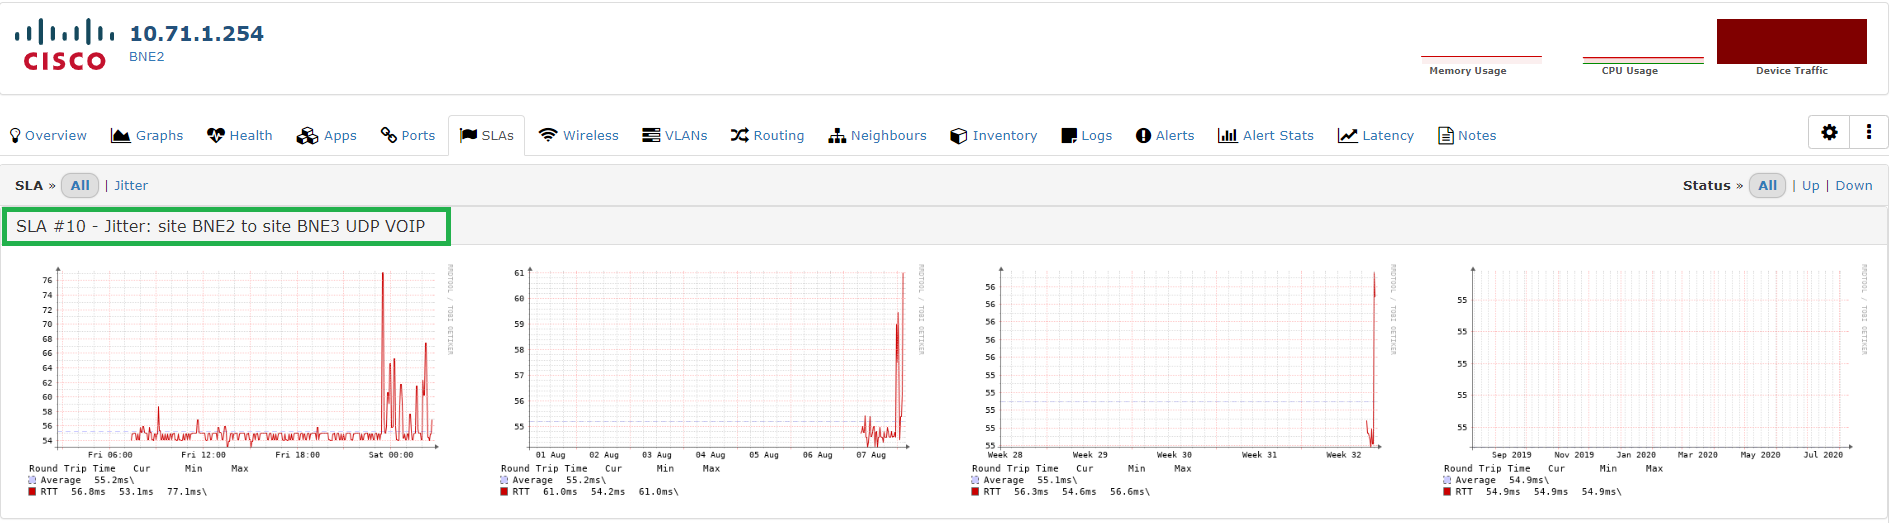
Current Graph: