Couldn’t find an answer so figured I would ask here.
Installation:
Librenms - Influx - Grafana
Would like to find the metric for “Device.Status” (up or down) so my tech can make a pretty Green or Red button in Grafana.
but for the life of me I can’t find where or how to pull that information.
Someone have a idea?
Thank you much.
Uptime is available. Also, there is a beta mysql data source.
I would also like to use grafana as a dashboard for my manager, The uptime metric is how long a device has been up since the device has rebooted not when ping connectivity has been lost due to the a link outage
I would like to use the device status in grafana so that when ping connectivity is lost to a device due the the link being down the single stat panel will turn red.
- Does anyone know how to do this
- Will it be possible to export the device status metric to influxdb as a feature request?
Thanking you in advance.
I ideally would like the status exported to infllux db can some assist with helping exporting this metric to influx.
is there some documentation on how other metrics are exported from librenms which can read.
I might have an alternative solution using the MSQL datasource for grafana…busy seeing if it will work.
how will that work to show up/down
I think it is 0 or something when the device is down. It won’t account for snmp down though.
thanks will give it a go and see what it does
Hey: Did you figure it out?
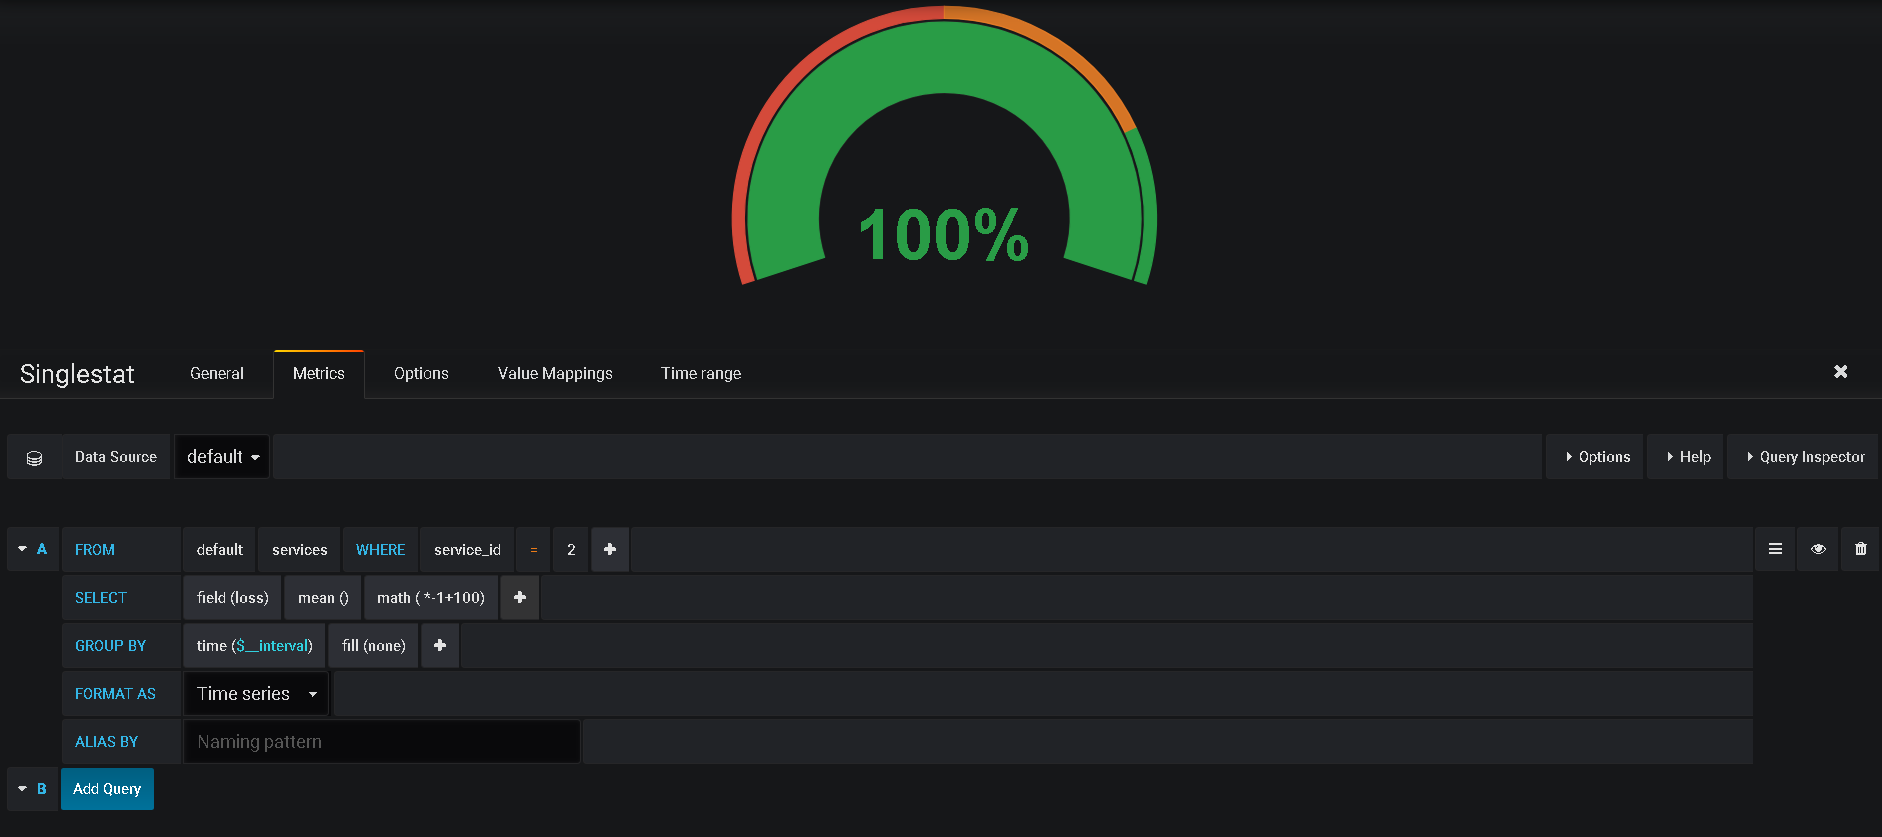
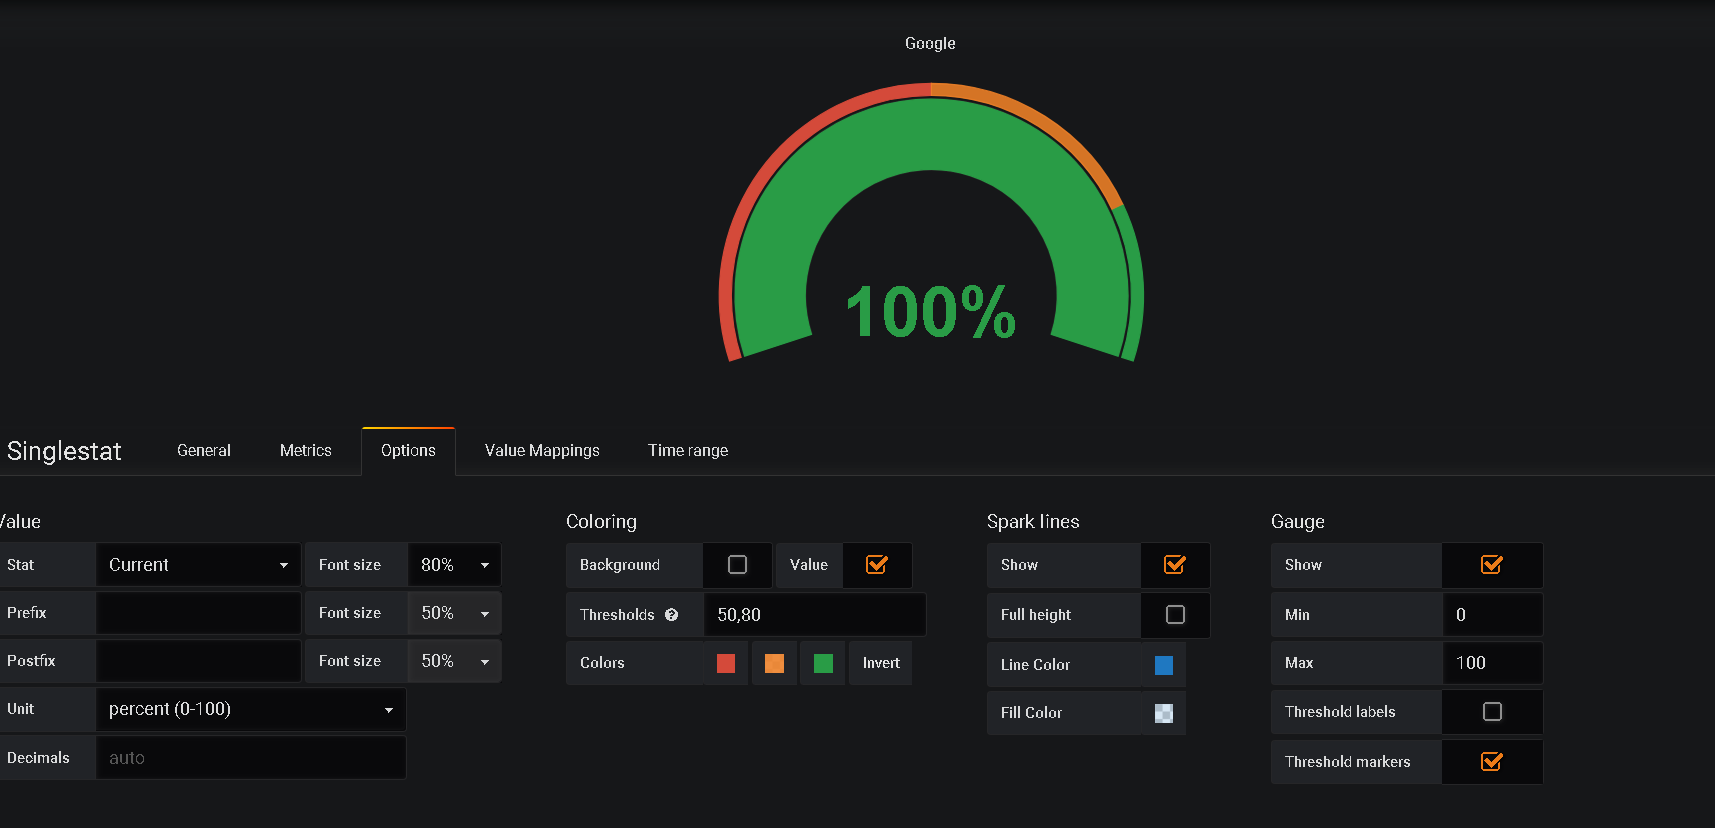
I has been playing with ping-perf but can’t get it to work as I want to, I just want the panel green when the host is up and red when is down.
Nope not yet, still trying