I will try to use ports.ifInOctets_delta or ports.ifOutOctets_delta gauges. so I would use 1000000000 for 1000MBps is this the right config to monitor 1000MBps I mean I want to receive an alert when the bandwidth goes lower than 1000MBps ?
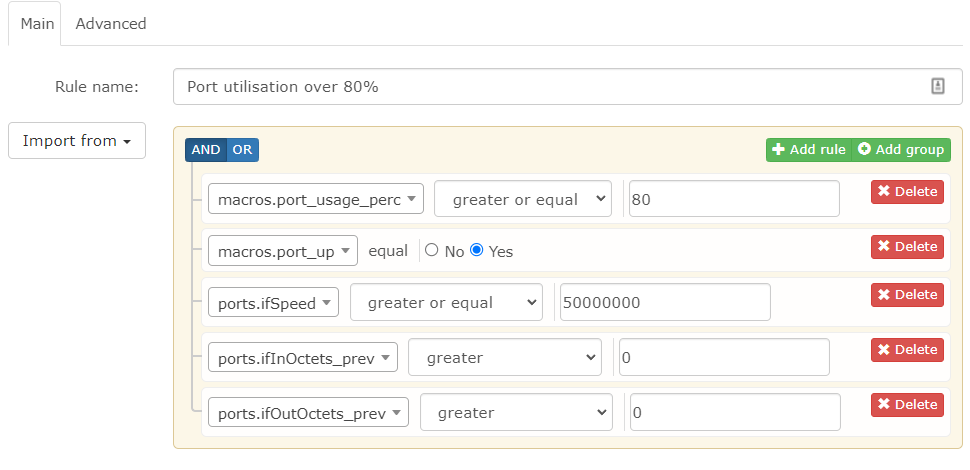
I use macros.port_usage_perc to do most of the work - it choses the highest value between in and out then works out what percentage of the interface speed it is, so I’m checking for >= 80.
I have a couple of “workarounds” in my conditions for issues. The ports.ifSpeed test is to cause the rule to ignore ports with link speeds of <50Mbps (10Mbps) as most of our PC’s switch from gigabit to 10Mbps when they go into wake on lan standby, this can sometimes trigger bandwidth alerts because the previous 5 minutes worth of data throughput may be more than 8Mbps and LibreNMS now thinks the port is only a 10Mbps port so is overloaded…
Checking ports.ifInOctets_prev and ports.ifOutOctets_prev is greater than zero avoids false alerts when SNMP data is incompletely captured and some traffic counters return zeros instead of real values. These bad polling sessions also show up as large spikes on traffic graphs, but this test at least avoids alerting on it.
While I’m testing for percentage utilisation if you want to test for absolute traffic values you should use ifInOctets_rate and ifOutOctets_rate - this is the rate calculated with polling interval taken into account. (Eg not just the byte delta without information about how far apart the polling periods were)
ifInOctets is the raw (absolute) traffic counter from a network port as sent by SNMP. Testing directly on this is meaningless as it’s just a running count which also wraps around at some point.
If you want to measure bandwidth use ifInOctets_rate where the rate is calculated for you automatically with wraparound automatically dealt with as well.
Thanks för the input. I think i’ll give it a shot but my method works as well. Actually i have this method to monitor port utilization:
macros.port_usage_perc >= 80 AND ports.ifType = “ethernetCsmacd” AND ports.ifDescr LIKE '%Core%
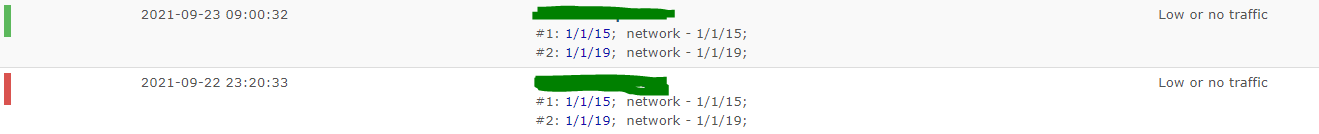
and this method to monitor if some ports have low or no traffic. Sometimes certain circuits go below 1% utilization. AFAIK it is not possible to set percentage value below 1%
ports.ifInOctets <= 125000 AND macros.port_up = 1 AND ports.ifDescr LIKE ‘%peering%’
If you’re trying to monitor traffic throughput, just doing a comparison on ports.ifInOctets can’t possibly work. It’s just an arbitrary 32 bit or 64 bit counter that shows how many octets have been received or sent on the port since the system booted or the counter last wrapped around.
This is the same on all network devices that report traffic counters for ports/interfaces etc via SNMP.
To calculate throughput from this you first have to subtract the previous counter from the current one, then normalise based on the polling interval, which defaults to 5 minutes in LibreNMS.
In LibreNMS the current traffic counter is stored in ports.ifInOctets (for traffic in…) and the value from the previous polling session is available in ports.ifInOctets_prev.
ports.ifInOctets_delta is the difference between the current polling session and previous session, so how many bytes have been received since this previous polling session, however this still doesn’t give you a rate because this value depends on how often the device is polled.
For that there is ports.ifInOctets_rate, which takes the polling interval into account to calculate actual throughput measured over the last polling interval. This is what you need to do a comparison against if you are testing for a specific traffic rate rather than a percentage of port throughput using the port_usage_perc macro.
I don’t use ports.ifInOctets_rate because I’m not interested in the absolute rate, only what percentage of the link rate is being used.
Hello @Dejan
Unfortunately, as it was already reported, it can’t be correct. @DBMandrake perfectly explained it.
I’ll try to rephrase it but ifInOctet (and out) are just increasing counters that possibly fill up the 32 or 64 bits, and get back to 0. Depending on the speed of the link, you may (or may not) capture a value below whatever arbitrary value you decide.
Check the graph and the alert, and you’ll see they do not necessarily match. Even if an interface with slow traffic will eventually loop and stay below your arbitrary value.
So please use ifInOctet_rate as it was explained to you. Because this is the correct way, and will give you the correct result
Official definition of ifInOctet :
The total number of octets received on the interface,
including framing characters.

Discontinuities in the value of this counter can occur at
re-initialization of the management system, and at other
times as indicated by the value of
ifCounterDiscontinuityTime.
I’v made changes to my monitoring regarding traffic dropping below certain threshold. It looks like this now. ports.ifInOctets_rate <= 131072 AND macros.port_up = 1 AND ports.ifDescr LIKE '%peering%'
131072 is number of octets equivalent 1 Mbit (e.g 131072 * 8 / 1000000)
If you want to be stricter, your Measured rate should be calculated as : Measured rate: {{ $value[‘ifInOctets_rate’]*8/1048576 }} Mbit/s
which can of course be simplified as Measured rate: {{ $value[‘ifInOctets_rate’]/131072 }} Mbit/s.
But I agree the difference is very limited.
If you encounter issues with the rate going zero (because of a missed poll or equivalent issue), you can use the tips and tricks from @DBMandrake to help filter them.