Hello
I have installed LibreNMS for the first time and most things work, except the latency graph which shows combined loss, min/avg and max latency (on page device/1/latency)
This would be very neat if that graph can work. I have tried using smokeping which works, but it creates several separate graphs. I would love to have to have the Latency performance graph working.
Any idea what can be wrong and where I can start looking to resolve this?
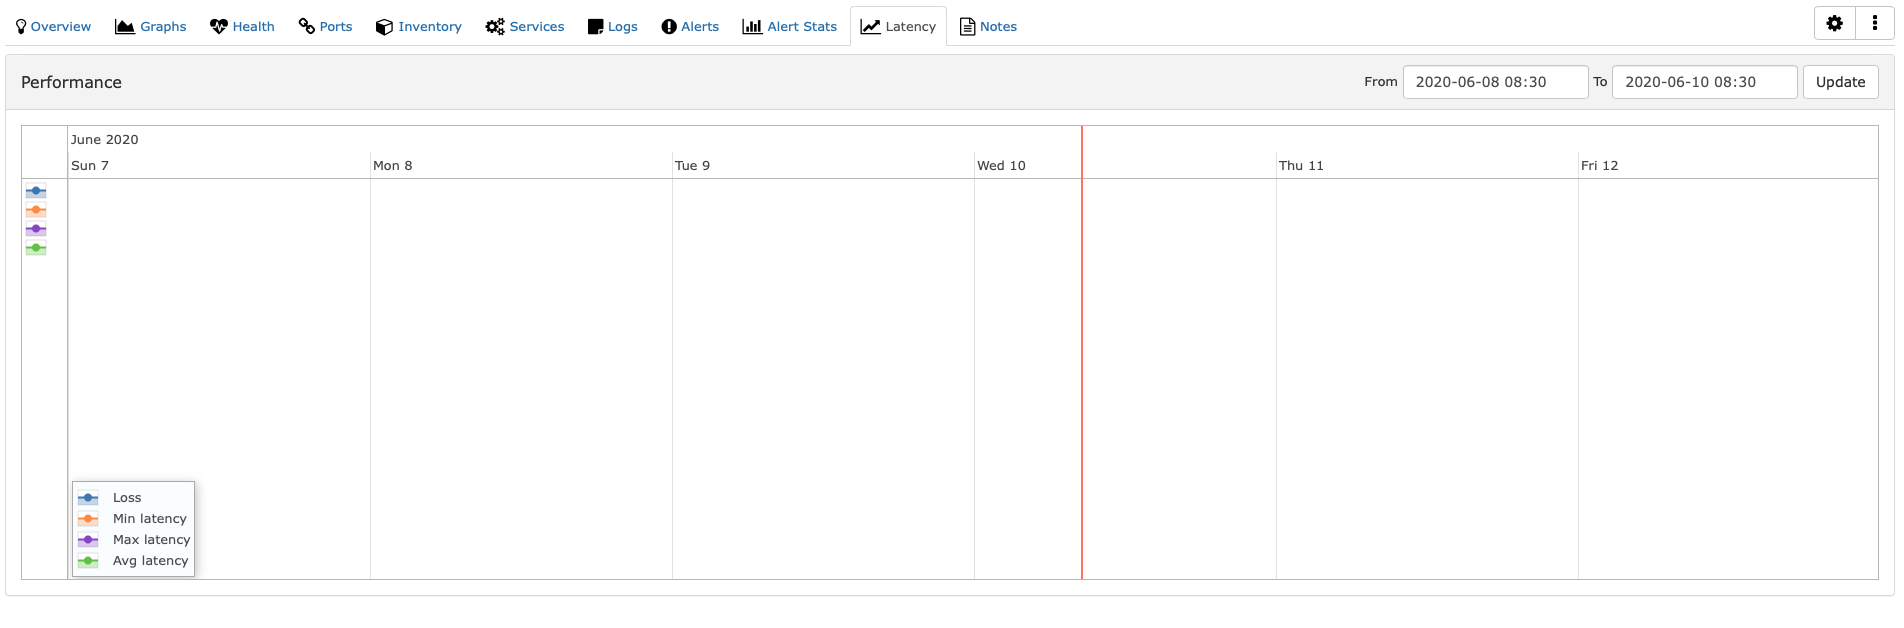
Nobody else experiencing this ? I have reinstalled on three separate new servers and same thing every time. All graphs are there except latency tab has nothing - as per screenshot.
Screenshot 2020-06-10 at 08.31.02|690x227
It seems as though no data is being logged in device_perf.
Run ./poller.php -d -m core -h <hostname> and pastebin the output.
Hi murrant
Thanx for replying so soon.
Not sure if I should use -h as well and specify a hostname as the command you provided gives error as per pastebin : https://pastebin.com/embed_js/UinigtHS
Hi there,
Here you go - I just ran it against localhost but if you want to see on any of the other servers please let me know.
https://pastebin.com/embed_js/42aQxTsV
Try these queries. Let me know the output 
INSERT IGNORE INTO `device_perf` (`xmt`,`rcv`,`loss`,`min`,`max`,`avg`,`device_id`,`timestamp`,`debug`) VALUES (1,2,3,0.01,0.02,0.03,22,NOW(),"[]");
INSERT INTO `device_perf` (`xmt`,`rcv`,`loss`,`min`,`max`,`avg`,`device_id`,`timestamp`,`debug`) VALUES (3,2,1,0.03,0.02,0.01,22,NOW(),"[]");
SELECT * FROM device_perf WHERE device_id=22;
Good Morning,
I have done as you requested, herewith output of the select statement which I sent to a txt file.
https://pastebin.com/embed_js/wxYr3ZhB