We have 3 instances of Librenms, all behaving the same way, all running the same versions, as pasted below.
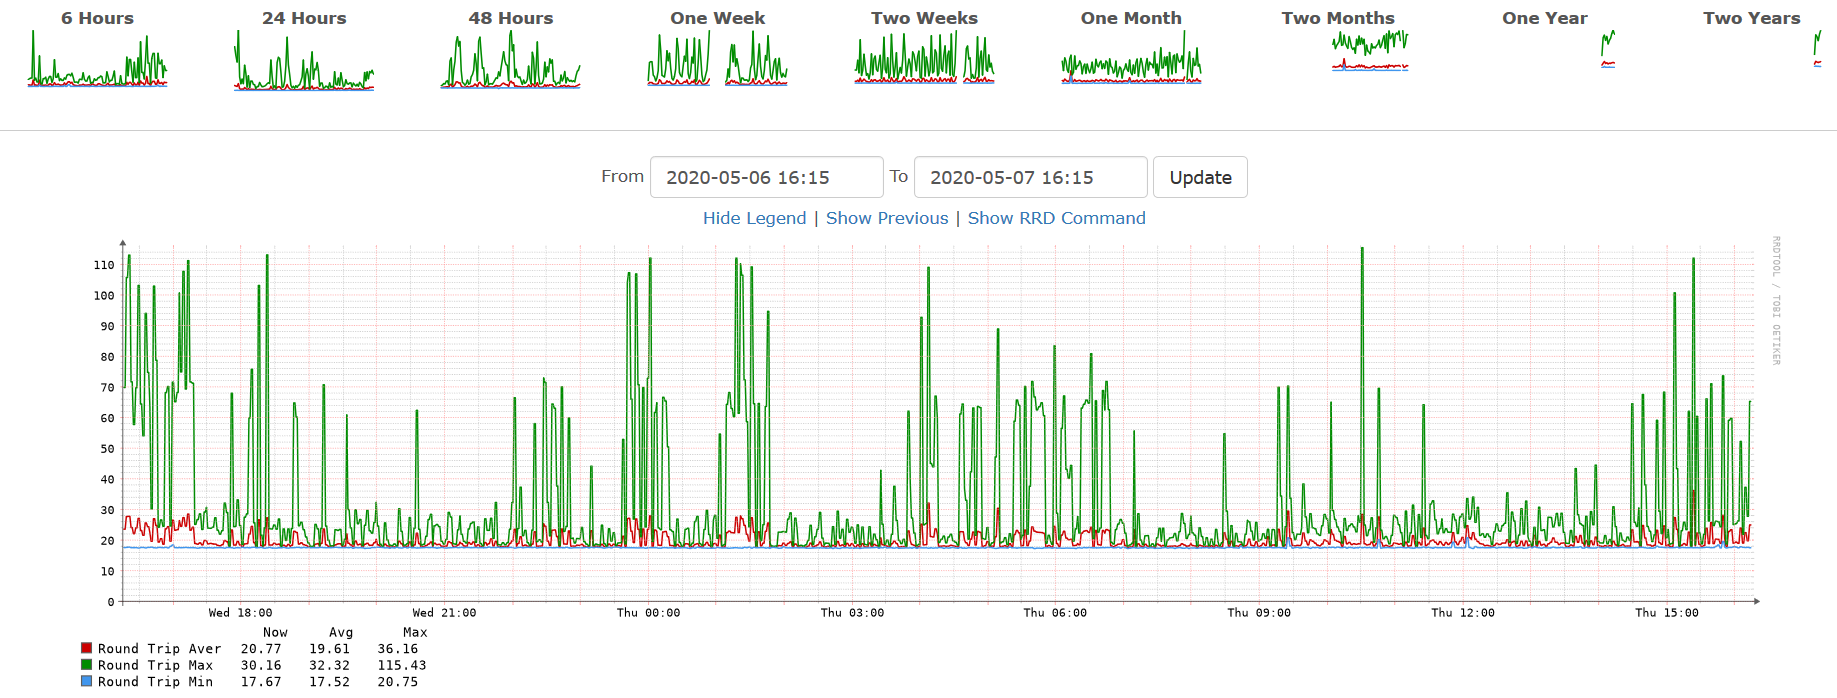
At some point when/after the performance page was renamed latency, the ability to see the latency history disappeared. I cannot trigger it, and when I try manually entering a date, I get a 419 / page expired error.
We keep these records for 28 days and is our primary tool for investigating infrequent or short outages. Any help on restoring access to this information would be appreciated.
Here’s a video of the behavior:
Thanks.
validate.php output:
====================================
Component | Version
--------- | -------
LibreNMS  | 1.63-41-g2533064
DB Schema | 2020_04_13_150500_add_last_error_fields_to_bgp_peers (164)
PHP       | 7.2.27-5+ubuntu16.04.1+deb.sury.org+2
Python    | 3.5.2
MySQL     | 5.7.29-0ubuntu0.16.04.1
RRDTool   | 1.5.5
SNMP      | NET-SNMP 5.7.3
====================================

[OK]    Composer Version: 1.10.6
[OK]    Dependencies up-to-date.
[OK]    Database connection successful
[OK]    Database schema correct
i never used that bc it caint “slide” like the other graphs, and its only a ping check be4 snmp polling.
so is it usefull?
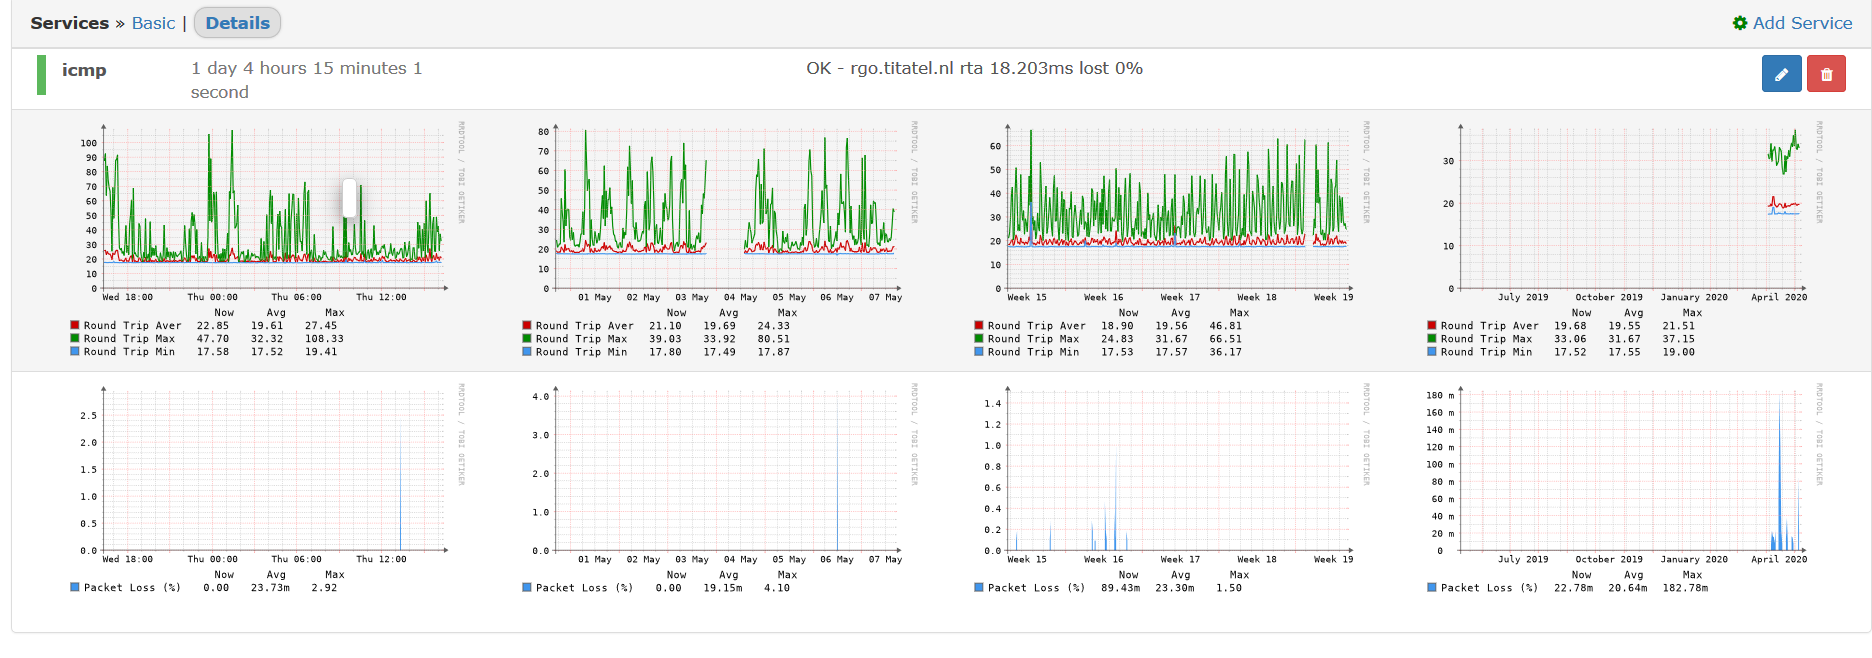
i use service ICMP for this on the desired host, whit (imo) a better vieuw.
ICMP -n 10 ( Do it 10 times )
- u can make alerts on the services.
This is my vieuw on this sh** “latancy” tab and a better vieuw.
yes u can tweak an RRD plot that looks like smokeping, but this is the standaart it creates. (or use smokeping…)
It’s useful from the standpoint if someone calls and says they were down 3 times in the past two weeks, we can look and confirm whether our equipment was down or it was something else. We can also see changes to response times, thus potential load, isolated bottleneck or interference issues, see persistent or inconsistent packet loss, etc, on every device in our network, allowing me to trace problems that occurred up to 1 month previous through the network if necessary. It’s a tool used in conjunction with the other graphs, but it’s my first stop when there’s an outage reported and in the first 3 stops when people complain about speed issues.
I have something for troubleshooting known problematic connections, but I can’t point that at every device we monitor. I do like your example above, if I can run a cronjob targeting problem connections and get librenms to display the data, that will be much better than what I’m using.
Page expired… Looks like we dont send the CSRF Token haha
Should be reported as bug, likely a very simple fix 
I will do that, but how can I do that? Apparently we submit bugs on this platform, so do I just create a duplicate thread, essentially? I don’t see where I can modify the subject of the thread at this point.
Thanks.