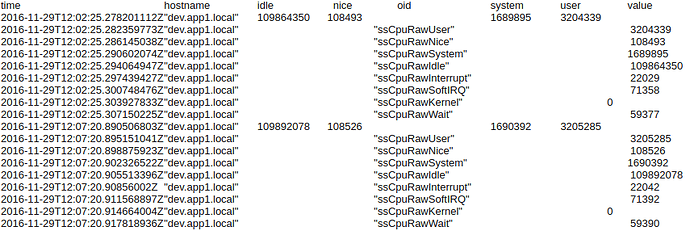
I can integrate influxdb with Librenms and data populated in InfluxDB successfully.
Some of the values like uptime, logins and so on , can show up in Grafana easily. But unable to plot value for Detailed CPU Percentage usage , Disk I/O, Swap I/O.
Could you please give me the exact formula to calculate it ?. Since I tried to below equation to calculate CPU percentage,
Idle Percentage = [ idle / (ssCpuRawUser+ssCpuRawNice+ssCpuRawSystem+ssCpuRawIdle+ssCpuRawSoftIRQ) ] * 100
Is the formula correct ?. Since using this formula, data showing wrongly on Grafana.
InfluxData sample:
Can I get formulate for Disk I/O and Swap I/O too ?.
