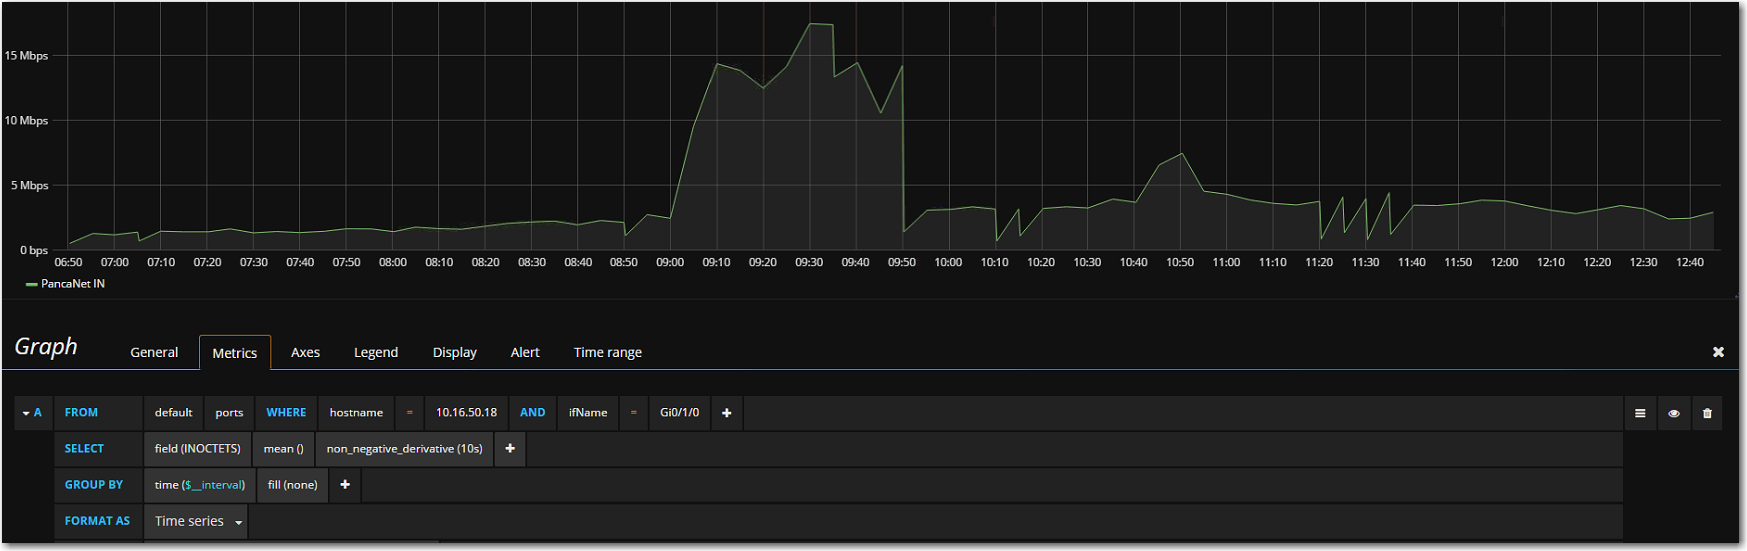
Can’t see your time interval there. However I’m not really sure we can say anything to help out, we send the same data to rrd and influx, the calculations for using that data when graphing isn’t something we can influence. I also don’t really see that much different between the graphs, if you smoothed out the grafana one it would probably look similar.
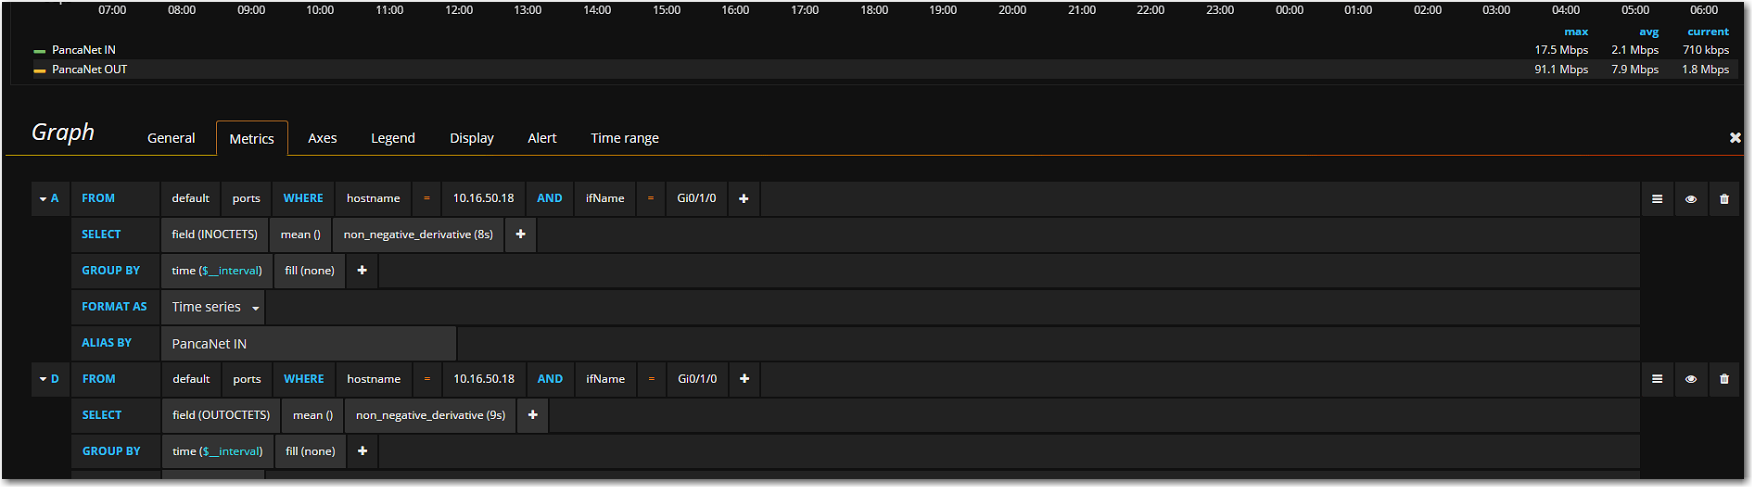
It looked really similliar, i just need to clarified the query, to make sure it has same data with librenms, because when i see on the summary, the libre has a little small statistic data then the grafana, i change the non_negative_derivative to 8s it really near same,
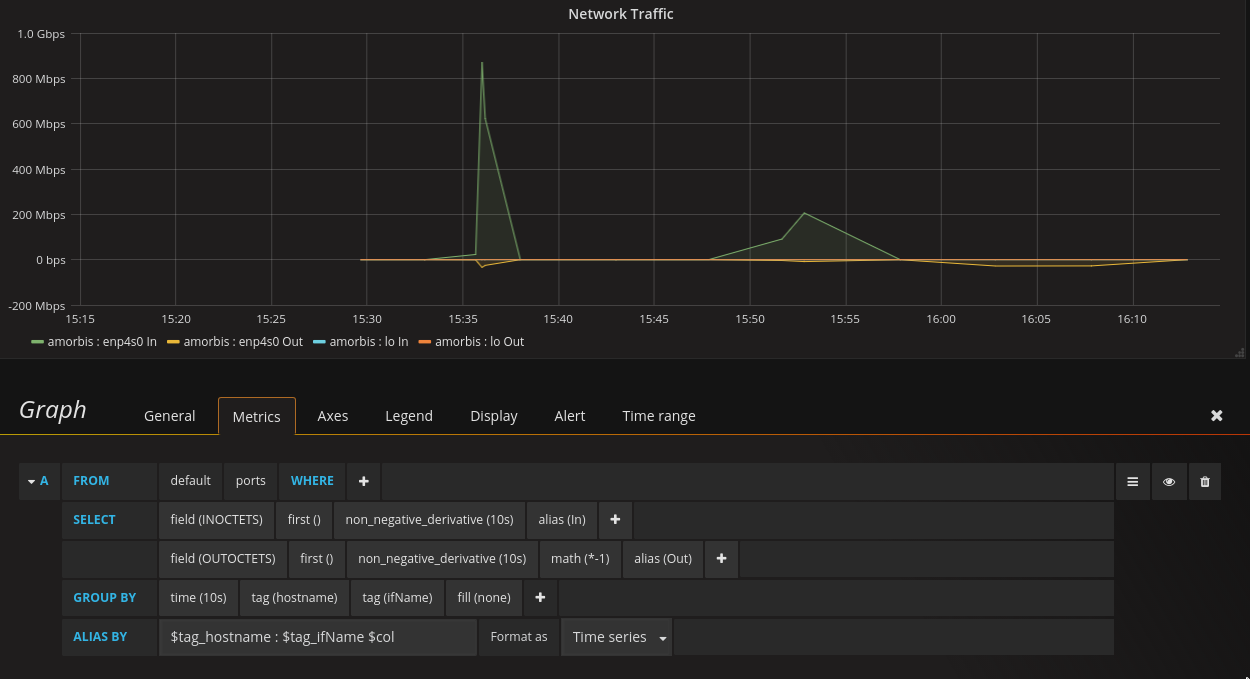
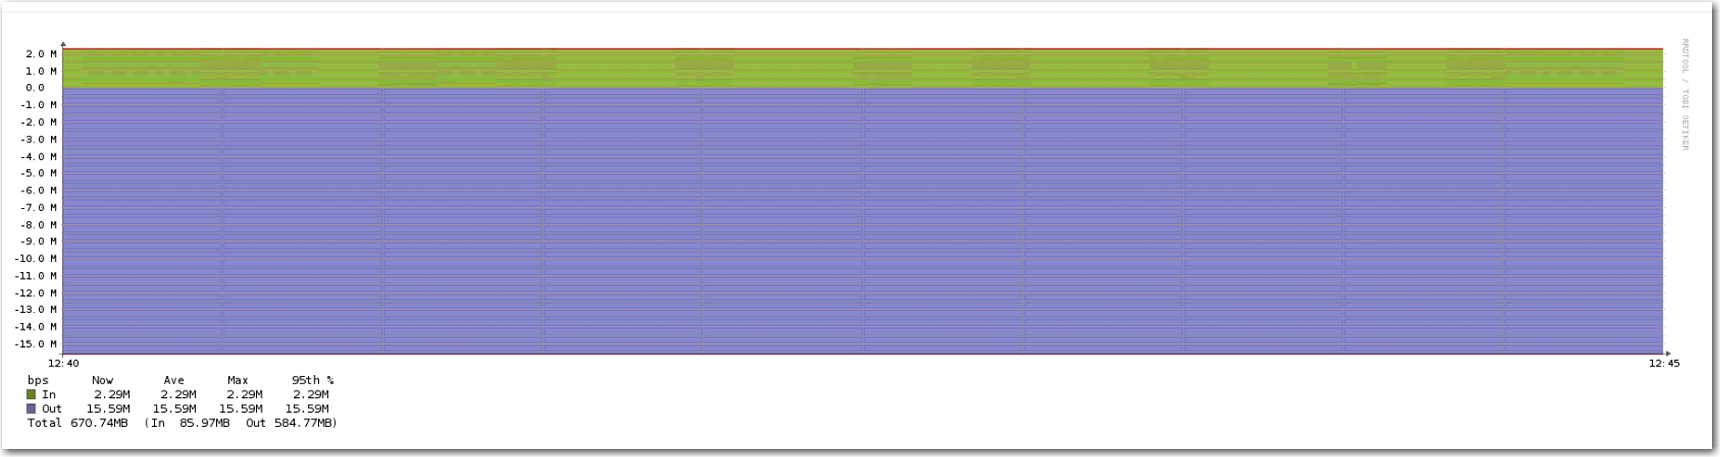
are you know your picture of librenms it’s with Bits and in your grafana you displaying with octect
if you want to have the same you must do this
go to
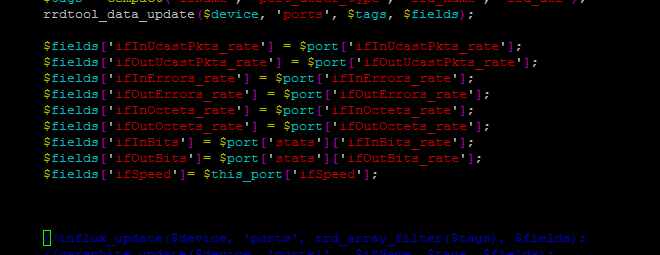
vi /opt/librenms/includes/polling/ports.inc.php
and add this line
$fields[‘ifInBits’] = $port[‘stats’][‘ifInBits_rate’];
$fields[‘ifOutBits’]= $port[‘stats’][‘ifOutBits_rate’];
 just wait the moderator and admin reply
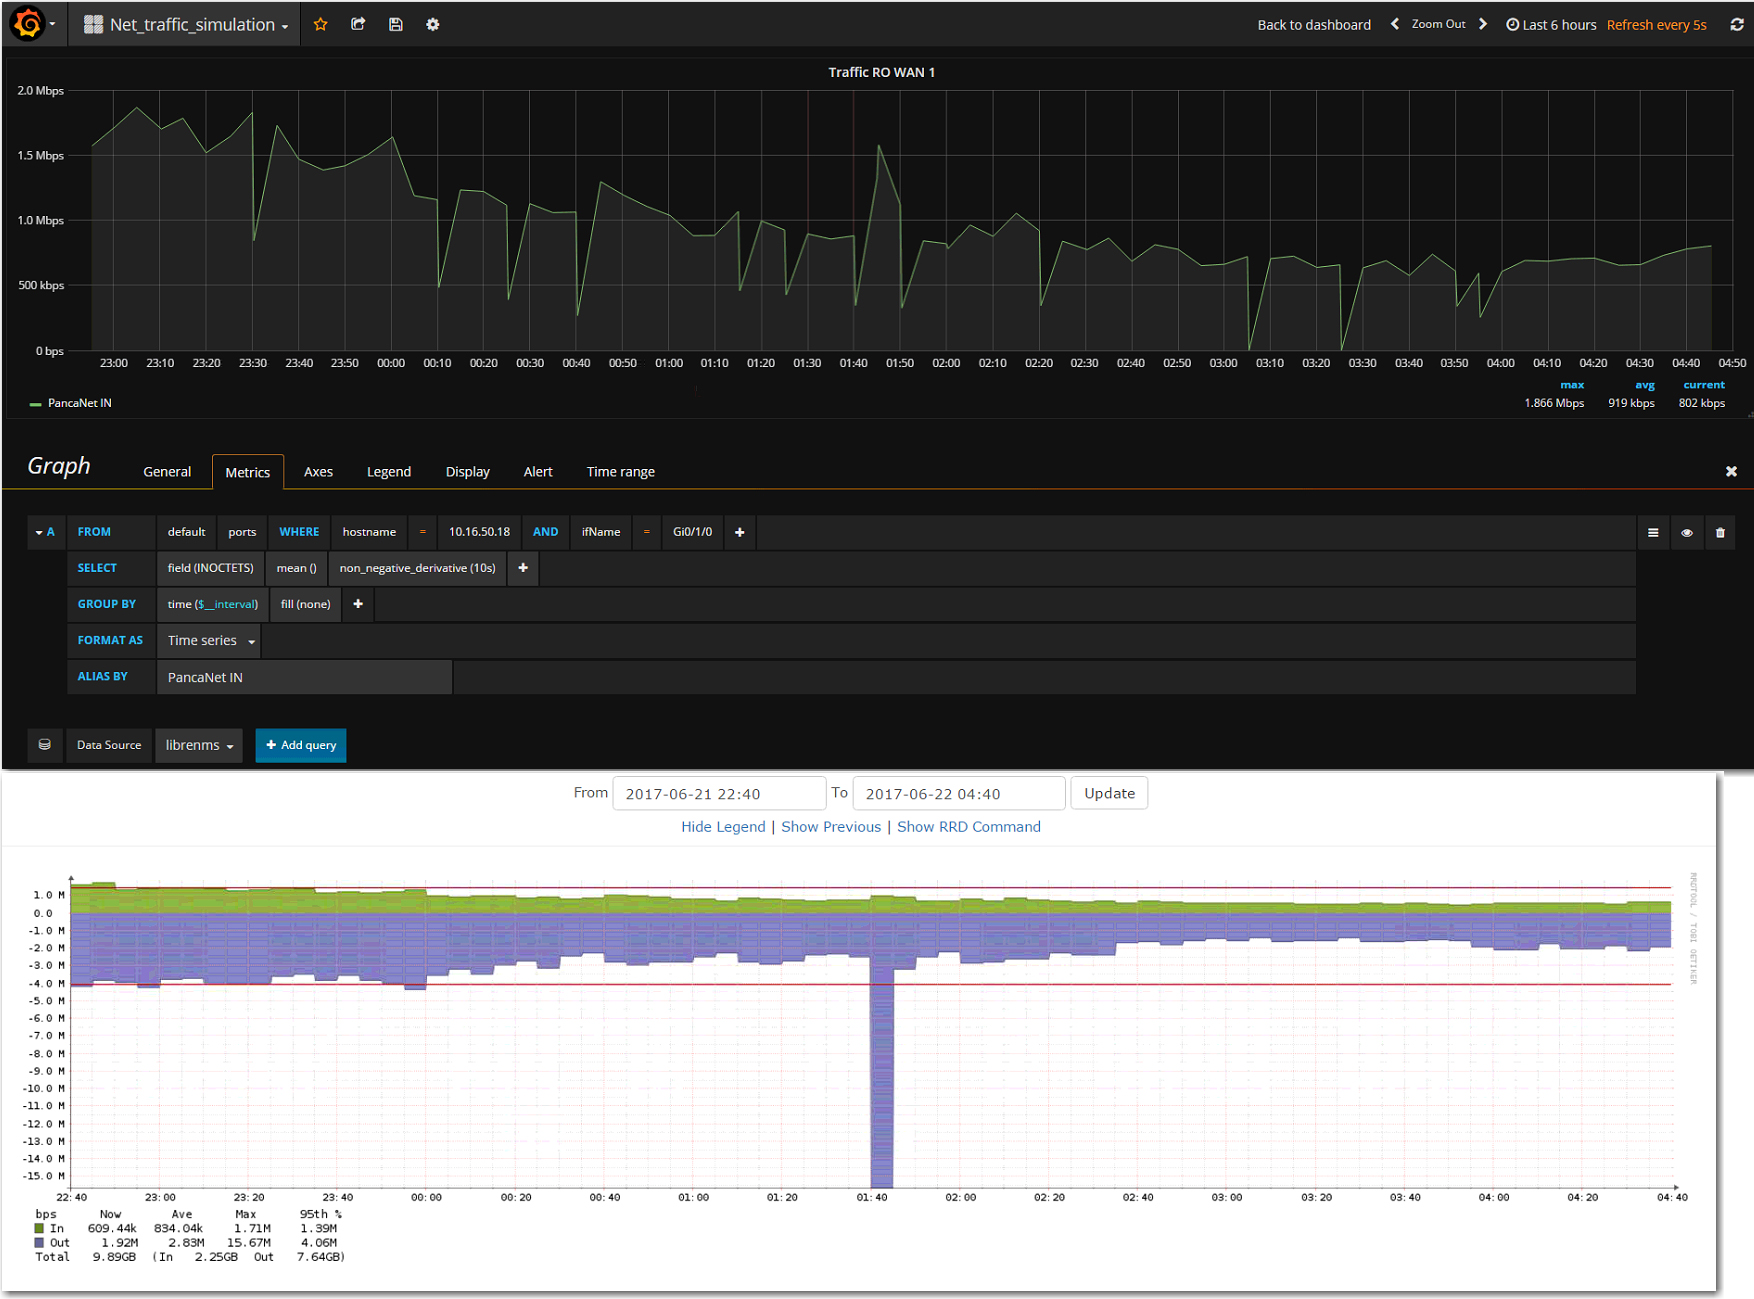
 Hope you can see where the data interpretation goes a little changed.
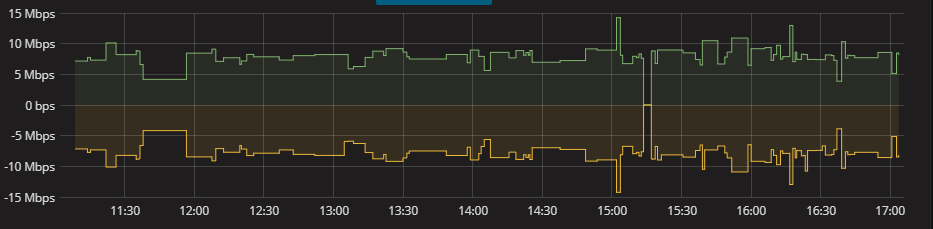