Hi,
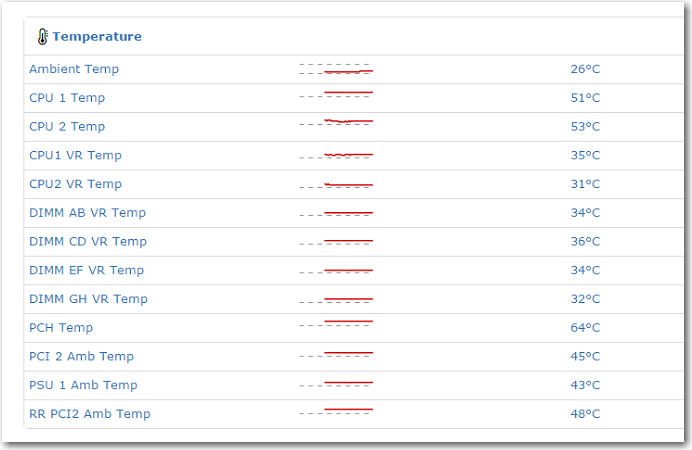
I already successfull to integrated the lenovo server to librenms, and can got temperature with ipmi access
https://community.librenms.org/uploads/default/original/1X/ed0296b8b39a07c0af4d52e2397b66dea00c8e21.png
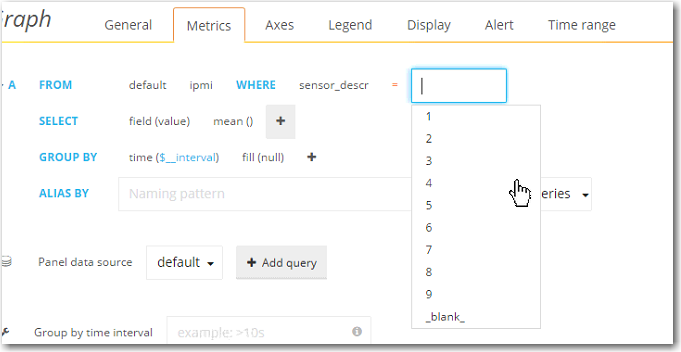
but i need to display the metrics to grafana, to make one dashboard for monitoring with other platform, so i use influxdb to integrate with grafana
the ipmi sensor_descr just has value 1 until 9
its different with the cisco product
https://community.librenms.org/uploads/default/original/1X/76ea652eeb9150e1719bca511206d0ae139e4674.png
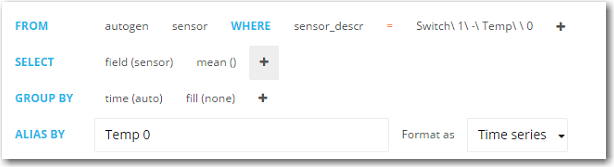
can i get the metrics like the cisco product?
Regards,
This is a Grafana question. Also, you can type any value you want there, those are just suggestions.
ridhoyp:
Hi,
I already succe
Hi,
Thanks for reply,
Alright i will go to grafana
Regards,
Did you try to type the value you wanted in the field?
Hi,
I dont know what the value i must type, and i dont know how to see it in the database, iam still new, is this step already successful before? to add host snmp and its ipmi credential, because i see the different query, cisco use sensor but host with ipmi temperature use ipmi metrics, i use ipmi just for getting the temperature query to grafana, but seems wrong.
i already create the topics in grafana
Hi, i dont know the sensor_desrc ipmi acually will show, but i assume its look like this 🙂 Is the problem getting the right metrics from LibreNMS into InfluxDB or is the problem querying the metrics from InfluxDB in Grafana? <-- i already ask...
Regards