I am working to improve the performance of my LibreNMS server.
Upon installation I have found that pages load very slow, sometimes spinning for a long time and loading nothing.
I am working on a server with 8GB of memory and 12 CPU cores and high-performance solid state storage.
I have done and validated all the performance tips in the guide including memcached and rrdcached. I have also reconfigured the server to use Apache2 in agent mode and PHP7-FPM, as well as done some small database tweaks in /etc/mysql/my.conf which I have tried my best to read and learn about before changing.
Sometimes pages will load instantly upon click. Other times they will just spin forever.
I only have the localhost being monitored and another device which is a Cisco CMTS. This device has an unsettling amount of interfaces and as such it is nearly impossible to be able to go to the menu Ports >> All Ports as it just will not load them all. I would like to completely disable many of these ports from being in the LibreNMS system but I do not see configuration directives available to do this based on “Interface Status” just “Interface Description.” I am still not sure this would completely correct the slowness. If it is this slow with one or two devices, I can’t make the case to scale to my infrastructure where we have over 10 of these particular devices alone.
Any ideas on what else I can check to improve the performance? I am really out of ideas.
root@OSS-TEST-02:/opt/librenms# ./validate.php
==========================================================
Component | Version
--------- | -------
LibreNMS  | f5ce3c509aaf2d3a7ddda4e92631220505918a55
DB Schema | 152
PHP       | 7.0.8-0ubuntu0.16.04.3
MySQL     | 10.0.28-MariaDB-0ubuntu0.16.04.1
RRDTool   | 1.5.5
SNMP      | NET-SNMP 5.7.3
==========================================================

[WARN]  Your install is out of date, last update: Tue, 27 Dec 2016 20:37:03 +0000
[OK]    Database connection successful
[FAIL]  The poller has not run in the last 5 minutes, check the cron job
[WARN]  Your local git contains modified files, this could prevent automatic updates.
Modified files:
         html/.htaccess
Really, any page that has a lot of graphs to draw. For instance, on the device page, it loads the entire interface list (I have devices with over 600 interfaces) and then it draws the aggregate traffic graph for the device. Then also, there are 50+ temp/current/voltage/dbm graphs that are also loading.
I have disabled the mouseover and lazy load to try and help, but these pages still take forever.
I am working on getting memcached, rrdcached, apach, and mysql application monitoring working. Hopefully this will help with diagnosis.
Chrome Tools shows 22 seconds to load the page. It appears to load the graphs sequentially, one after another… I don’t know if it is feasible to request them concurrently via jquery.
I think this is purely the number of graphs being loaded for you. i don’t have anywhere near the number of requests for graphs as you (closest is a quarter of the number) and get load times of 7 seconds (which is mostly graphs lazy loading the so the page appears responsive).
We’ll have to do some work on this to try and lower the number of requests - I’d suggest creating an issue on github with the info you’ve provided so far.
I will second the problem that clay has outlined, and I think I am probably the worst case scenario due to the sheer number of interfaces I have on some of the devices in my LibreNMS. memcached, rrdcached, php-fcgi and mysql tweaks aren’t enough to make much of a difference. I do agree that something needs to be done to improve this if LibreNMS is going to be considered scalable, so if GitHub is the next place to go, I will head there.
I’ve come across this a bit today on our work install due to some new devices with 1500 ports.
The overall traffic graph is what seems to kill it. That graph specifically has the ability to exclude certain interfaces so I added ones we don’t care much for to the list and it’s massively improved the performance:
What i can see is that even its not IO related, it could be slow cause of on disk temp tables.
The mysqltuner shows the following:
[!!] Joins performed without indexes: 107010
[!!] Temporary tables created on disk: 32% (11K on disk / 34K total)
It was over 50% when i set the join buffer size of 2M.
Now I’m on 32M, but this value is very high in my opinion.
It feels faster if i set it to 128M, but then i get a warning cause of dangerous settings in mysqltuner.
maybe the joins should be checked?
The fact that a widget is loading slow is odd as that’s just php / mysql based. Considering you only have two devices monitored then this really does indicate a local issue but I’m not sure what else to suggest.
I’m not the one who have only two devices.
I have 100 devices, and about 1500 ports.
It’s not that much, but more than two.
As written before, alot joins without indexes and this caused alot disk temp table.
This is mysql related.
So a php / mysql widget can get slow, if it needs disk temp tables.
I have done some more analysis.
It’s not the widget itself.
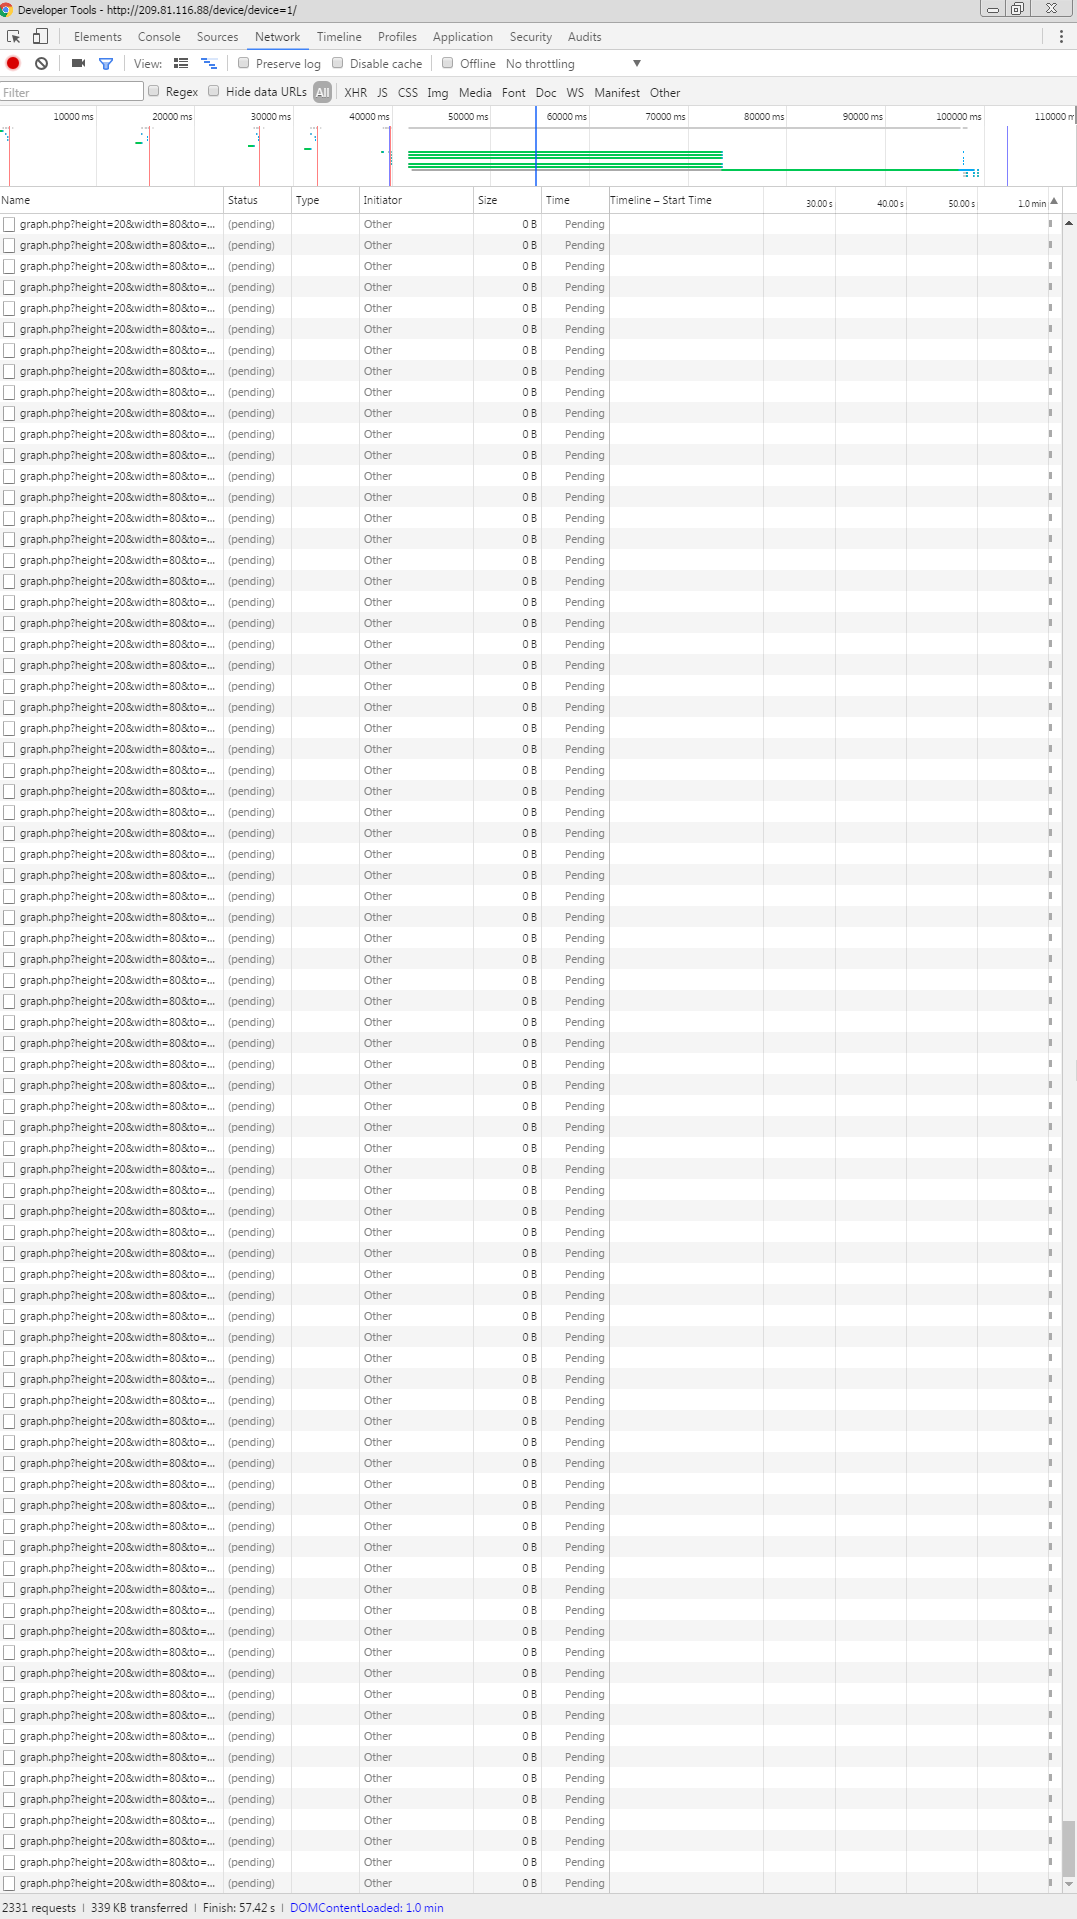
The high cost requests (in network tab) are the graph.php?..
Others get queued behind this requests.
It seems the graphs generagion is not that fast.
Is there a way to cache the graphs itself? (not only the rrd data)
maybe it would be required to generate graphs on poll time to get the webfrontend work responsive on bigger environments, or is this a bad idea?
on my dashboard it loads 15 graphs every time it gets refreshed.
the fastest graph here is on 851ms, the slowest is on 3,4s
cause there are i think about 4 or 5 request at the same time it gets slow, because the other requests are waiting seconds to start.