Hello,
I encounter multiple problems with LibreNMS, which seem to be related to polling time:
The output of ./validate.php :
Component
Version
LibreNMS
24.4.1-27-gfe2f8a6c8 (2024-05-01T20:15:27+01:00)
DB Schema
2024_04_22_161711_custom_maps_add_group (292)
PHP
8.1.27
Python
3.9.18
Database
MariaDB 10.5.22-MariaDB
RRDTool
1.7.2
SNMP
5.9.1
===========================================
[OK] Composer Version: 2.7.4
I have a VM with 8 CPU/32 Gb RAM and 256 Gb SSD, with graph losses and high polling times.
Also, I see this at regular intervals:
[FAIL] No active polling method detected
Could you help me solve this?
Thanks
Likely some sort of configuration issue. I suggest reviewing the install docs and checking that your install matches.
Thanks for your help.
I have already gone through the installation procedure and tuned the DB using MySQLTuner, the performance has improved but I still have high CPU usage and an average polling time of 60 seconds per device.
Any other suggestions ?
Did you review which devices are taking the longest and see if you can figure out why?
Thanks for your help.
I just carried out a manual poll, but I’m not sure how to use the information below?
Thanks
bash-5.1$ lnms device:poll 113
Hostname: X.X.X.X (cisco)
Load poller module core
SNMP: [3/1.53s] MySQL: [4/0.26s] RRD: [4/0.00s]
Unload poller module core
Load poller module os
SNMP: [0/0.00s] MySQL: [1/0.01s] RRD: [2/0.00s]
Unload poller module os
Load poller module availability
SNMP: [0/0.00s] MySQL: [13/0.43s] RRD: [10/0.01s]
Unload poller module availability
Load poller module sensors
SNMP: [9/5.38s] MySQL: [29/0.77s] RRD: [126/0.12s]
Unload poller module sensors
Load poller module processors
SNMP: [1/0.61s] MySQL: [1/0.04s] RRD: [20/0.01s]
Unload poller module processors
Load poller module mempools
SNMP: [1/0.57s] MySQL: [1/0.01s] RRD: [6/0.00s]
Unload poller module mempools
Load poller module storage
SNMP: [1/0.56s] MySQL: [2/0.02s] RRD: [4/0.00s]
Unload poller module storage
Load poller module netstats
SNMP: [11/5.21s] MySQL: [0/0.00s] RRD: [12/0.01s]
Unload poller module netstats
Load poller module hr-mib
SNMP: [1/0.47s] MySQL: [0/0.00s] RRD: [2/0.00s]
Unload poller module hr-mib
Load poller module ucd-mib
SNMP: [2/0.94s] MySQL: [0/0.00s] RRD: [2/0.00s]
Unload poller module ucd-mib
Load poller module ipSystemStats
SNMP: [1/1.40s] MySQL: [0/0.00s] RRD: [6/0.00s]
Unload poller module ipSystemStats
Load poller module ports
SNMP: [26/18.34s] MySQL: [30/0.38s] RRD: [50/0.07s]
Unload poller module ports
Load poller module customoid
SNMP: [0/0.00s] MySQL: [1/0.01s] RRD: [2/0.00s]
Unload poller module customoid
Load poller module bgp-peers
SNMP: [16/7.08s] MySQL: [17/0.20s] RRD: [22/0.02s]
Unload poller module bgp-peers
Load poller module ucd-diskio
SNMP: [0/0.00s] MySQL: [1/0.07s] RRD: [2/0.00s]
Unload poller module ucd-diskio
Load poller module cisco-ipsec-flow-monitor
SNMP: [1/2.81s] MySQL: [0/0.00s] RRD: [2/0.00s]
Unload poller module cisco-ipsec-flow-monitor
Load poller module cisco-remote-access-monitor
SNMP: [1/0.43s] MySQL: [0/0.00s] RRD: [2/0.00s]
Unload poller module cisco-remote-access-monitor
Load poller module cisco-cef
SNMP: [4/5.11s] MySQL: [7/0.06s] RRD: [8/0.00s]
Unload poller module cisco-cef
Load poller module slas
SNMP: [0/0.00s] MySQL: [1/0.01s] RRD: [6/0.00s]
Unload poller module slas
Load poller module cisco-mac-accounting
SNMP: [0/0.00s] MySQL: [1/0.01s] RRD: [2/0.00s]
Unload poller module cisco-mac-accounting
Load poller module cipsec-tunnels
SNMP: [1/0.73s] MySQL: [1/0.01s] RRD: [2/0.00s]
Unload poller module cipsec-tunnels
Load poller module cisco-voice
SNMP: [5/3.29s] MySQL: [0/0.00s] RRD: [4/0.00s]
Unload poller module cisco-voice
Load poller module cisco-cbqos
SNMP: [0/0.00s] MySQL: [1/0.01s] RRD: [2/0.00s]
Unload poller module cisco-cbqos
Load poller module cisco-otv
SNMP: [0/0.00s] MySQL: [1/0.01s] RRD: [2/0.00s]
Unload poller module cisco-otv
Load poller module cisco-qfp
SNMP: [2/1.11s] MySQL: [10/0.14s] RRD: [6/0.00s]
Unload poller module cisco-qfp
Load poller module cisco-vpdn
SNMP: [1/0.49s] MySQL: [0/0.00s] RRD: [2/0.00s]
Unload poller module cisco-vpdn
Load poller module entity-physical
SNMP: [0/0.00s] MySQL: [0/0.00s] RRD: [2/0.00s]
Unload poller module entity-physical
Load poller module applications
SNMP: [0/0.00s] MySQL: [1/0.01s] RRD: [2/0.00s]
Unload poller module applications
Load poller module stp
SNMP: [0/0.00s] MySQL: [2/0.01s] RRD: [2/0.00s]
Unload poller module stp
Load poller module ntp
SNMP: [1/0.87s] MySQL: [4/0.03s] RRD: [6/0.00s]
Unload poller module ntp
Enabled graphs (18): uptime poller_modules_perf availability netstat_icmp netstat_icmp_info netstat_ip netstat_ip_frag netstat_snmp netstat_snmp_pkt netstat_udp netstat_tcp ipsystemstats_ipv4 ipsystemstats_ipv4_frag ipsystemstats_ipv6 ipsystemstats_ipv6_frag poller_perf ping_perf cisco-voice-ip
Start Alerts
Rule #39 (IPSec tunnels down):#52 (Interface Errors Rate greater than 100):#65 (Device Down - No ICMP response):#66 (BGP Session down):#70 (Device Down - SNMP unreachable):
End Alerts (0.0277s)
Start Device Groups
End Device Groups (0.0136s)
Polled XXXX (113) in 61.874 seconds <<<
SNMP [88/56.93s]: Snmpget[46/22.95s] Snmpwalk[42/33.98s]
Blockquote
If you look at /poller/log via webgui, you see what devices take longer time.
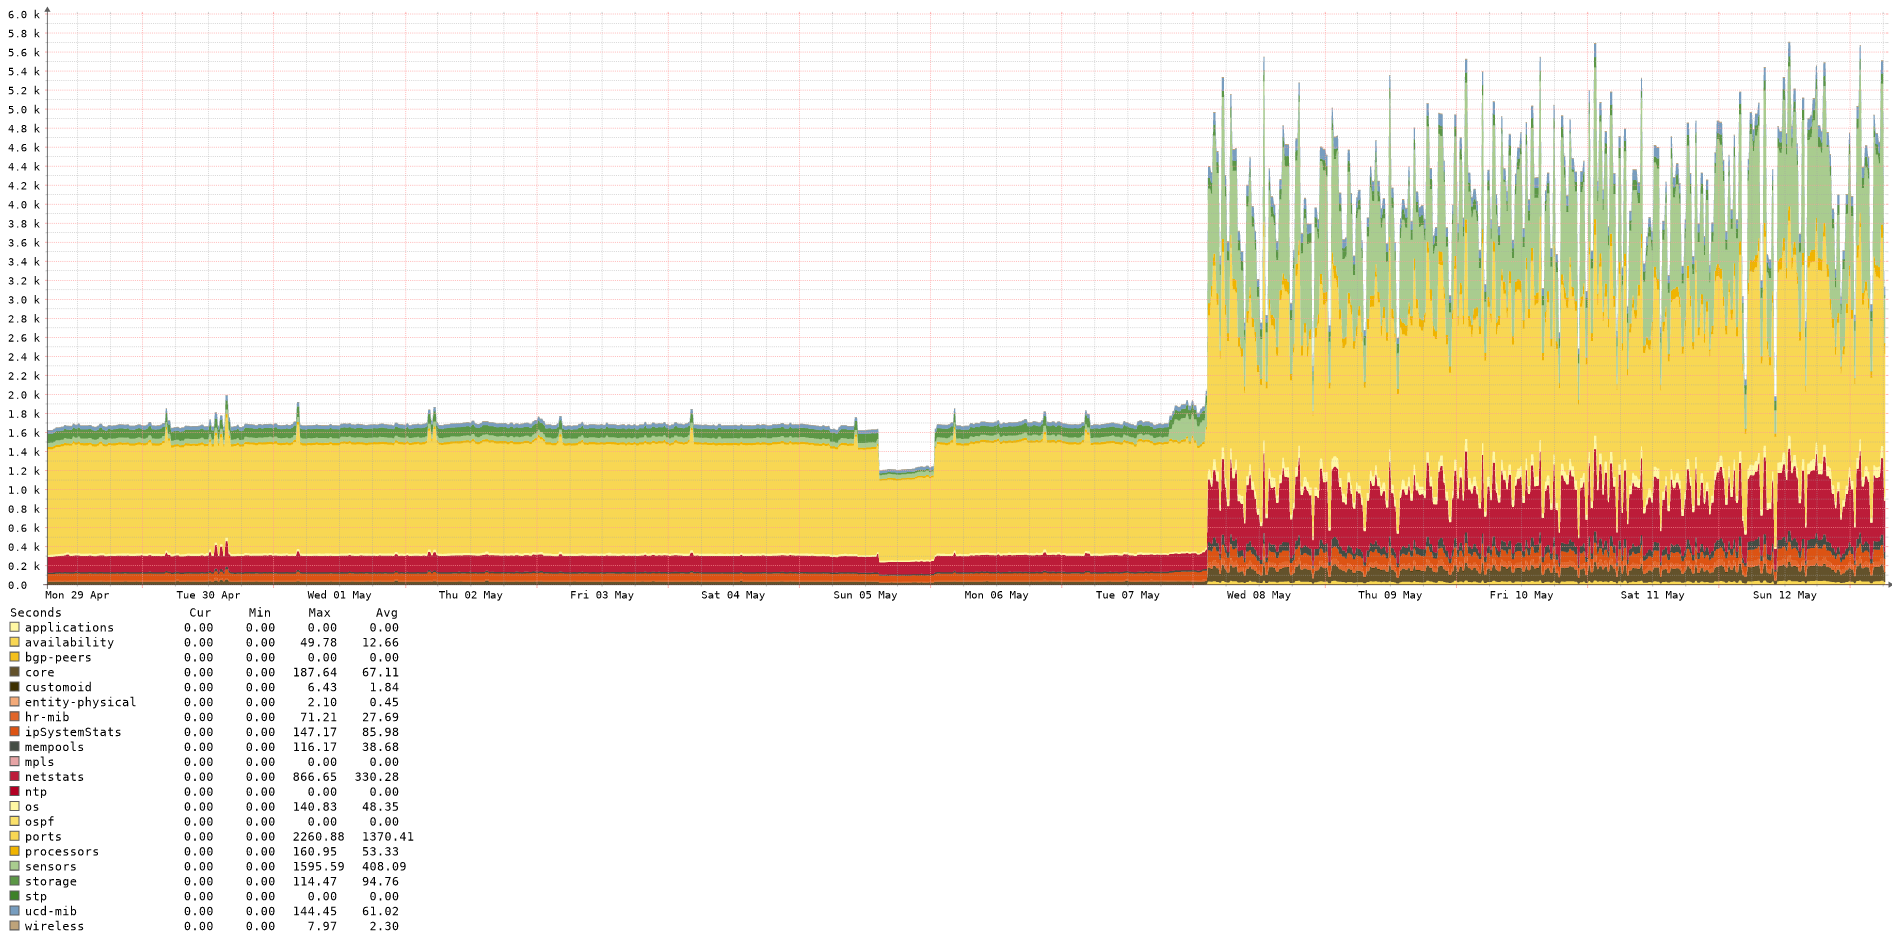
I am also experiencing increased CPU usage & polling times after upgrading to v24.4.1 (from 23.x).
2 week graph from poller performance. Update date is clearly visible.
pkill
15 May 2024 16:44
8
We’re seeing the same thing since our system updated on May 6.
One thing that can cause this is code that has errors in it and having error reporting enabled.
Two fixes:
report and fix the errors. (outside error reporting)
disable error reporting
system
13 September 2024 02:10
10
This topic was automatically closed 90 days after the last reply. New replies are no longer allowed.