I’ve been working on an update to port polling to help in certain situations. This was originally inspired by the way Zenoss do snmp bulk gets, unfortunately trying to use snmpbulkget doesn’t seem to be an option due to the consistency in which devices respond to these queries (Zenoss write there own snmp collector afaik). Anyway that led me on to doing multi gets like we do with sensors - this approach for ports actually slows things down if you have a fair number of ports, where it does improve things is where you have a lot of ports but a good % are either marked as deleted or disabled, in this situation port polling speed is improved.
To see if you would benefit from this then run this query in mysql: select device_id, count(*) as total from ports where deleted=1 group by device_id order by total desc;
I tested this on the device_id 128 and it improved polling times quite a bit.
If you would like to test it then please ensure you are on the current librenms master and then do the following:
cd /opt/librenms
git remote add laf [email protected]:laf/librenms.git
git remote update laf
git checkout port-perf
You can now either globally enable the new feature (not recommended: $config['poller']['selected_ports'] = true;) or per device by enabling the ‘Enable select port polling’ within the misc section of edit device
Please leave it running (no rediscovery needed) and let me know if polling time and ports polling time have decreased or increased and if so by how much.
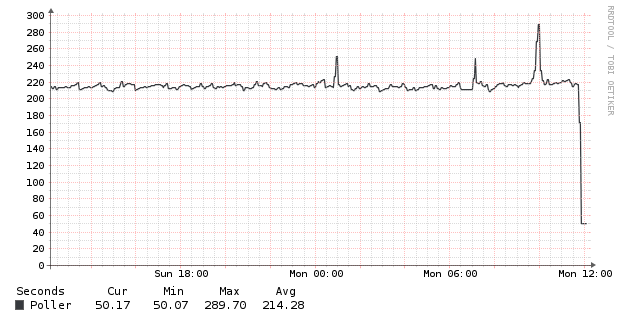
I’m testing this right now because I’ve been seeing 200+ sec poll times with some Juniper EX3300 virtual chassis with 4+ member switches. In the last few poll intervals, i’ve seen a significant decrease in poll time. I’ll test this with some other devices as well.
After running this for a couple of hours, I’m having to revert back to the regular polling method for my test-case switches.
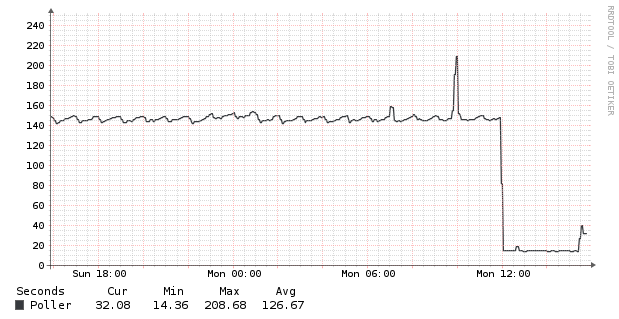
Polling time significantly decreased, however, the active interfaces appear to not be polled at all. I don’t have time at the moment to debug, but would be happy to when I’ve got time over the next couple of days. Any pointers on debugging steps I should take? I did notice that your branch was several commits behind master, and my installation generally stays up with master (via daily.sh).
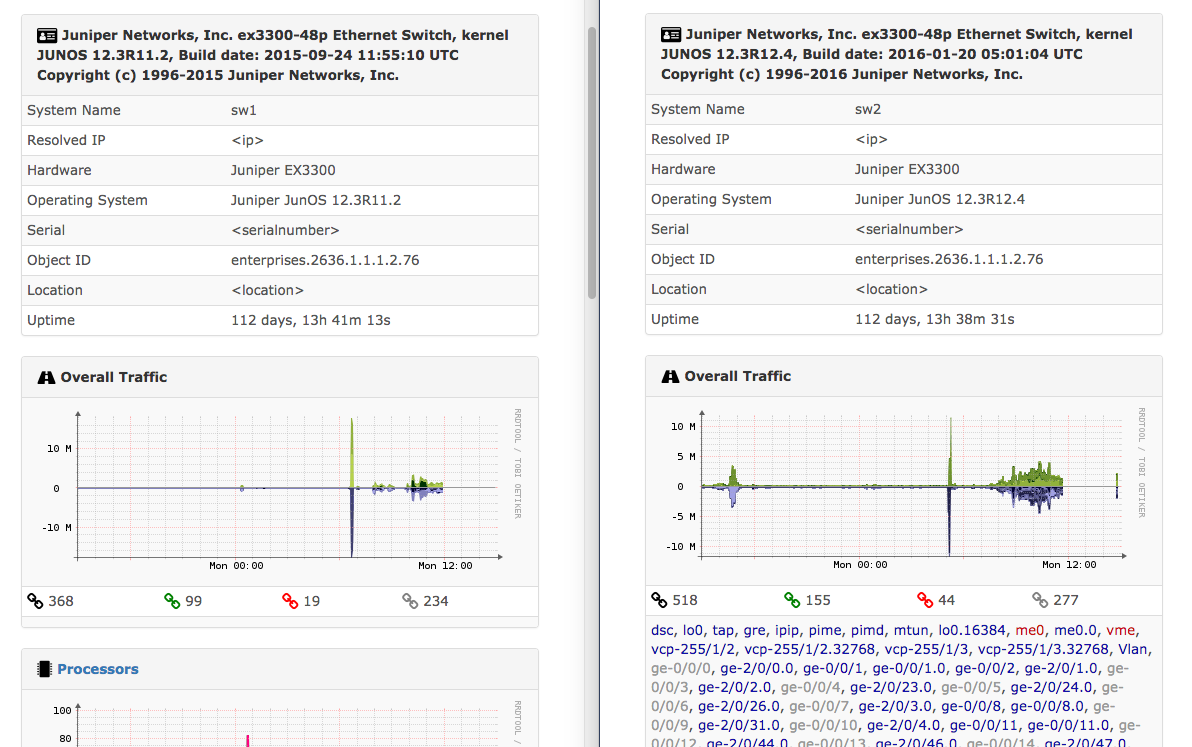
Clicking the Ports tab for a device presents an empty list, and no interfaces show up under the Overall Traffic graph, and the Overall Traffic graph seems to not be updating either. I’ve attached a side-by-side screenshot of two devices. Both are EX3300 virtual-chassis. The left side is still using the selected_ports attribute, and the other one was using the attribute, but is no longer. Note the gap in the Overall Traffic graph from around 12:00 to around 15:00 on the right (left is still not graphing), and the lack of ports below the graph on the left side.
Edit: I screwed up the hostname when I ran the poller script. polling with correct hostname now, will update the gist when I’ve sanitized certain info.
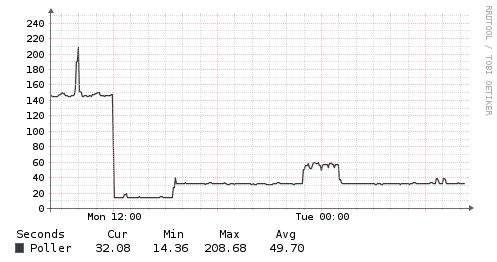
After pulling your branch, discovering and polling manually, the interfaces seem to be showing up again. I’ll let this simmer for a bit and get back to you.