Hello,
Please find MIB & OID for the Ucopia Controller
http://bit.ly/2tFvQ9z
(file available for download till 25th July)
As I’m a customer from this company, I got those files/info received directly from their IT dept.
OID References:
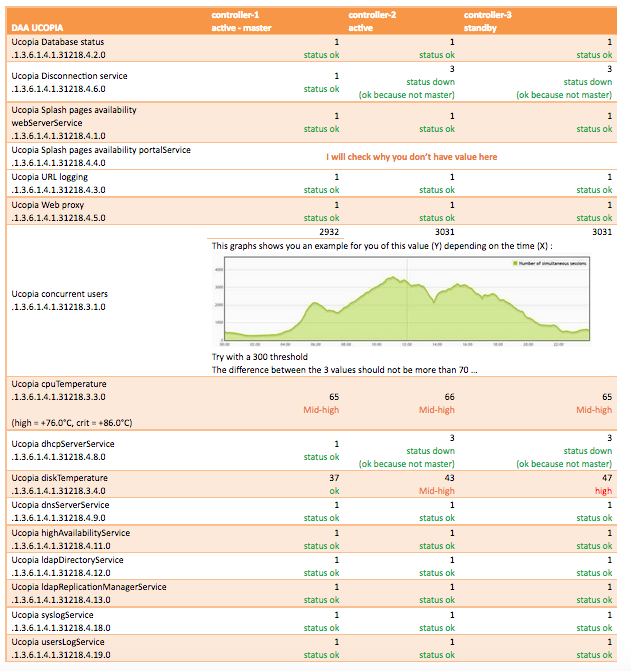
DAA UCOPIA
Ucopia Database status
.1.3.6.1.4.1.31218.4.2.0
Ucopia Disconnection service
.1.3.6.1.4.1.31218.4.6.0
Ucopia Splash pages availability webServerService
.1.3.6.1.4.1.31218.4.1.0
Ucopia Splash pages availability portalService
.1.3.6.1.4.1.31218.4.4.0
Ucopia URL logging
.1.3.6.1.4.1.31218.4.3.0
Ucopia Web proxy
.1.3.6.1.4.1.31218.4.5.0
Ucopia concurrent users
.1.3.6.1.4.1.31218.3.1.0
Ucopia cpuTemperature
.1.3.6.1.4.1.31218.3.3.0
(high = +76.0°C, crit = +86.0°C)
Ucopia dhcpServerService
.1.3.6.1.4.1.31218.4.8.0
Ucopia diskTemperature
.1.3.6.1.4.1.31218.3.4.0
Ucopia dnsServerService
.1.3.6.1.4.1.31218.4.9.0
Ucopia highAvailabilityService
.1.3.6.1.4.1.31218.4.11.0
Ucopia ldapDirectoryService
.1.3.6.1.4.1.31218.4.12.0
Ucopia ldapReplicationManagerService
.1.3.6.1.4.1.31218.4.13.0
Ucopia syslogService
.1.3.6.1.4.1.31218.4.18.0
Ucopia usersLogService
.1.3.6.1.4.1.31218.4.19.0
Regards,
Vdbseb1983 - Sébastien