Hi !
I’ve configured the Docker integration yesterday. After some struggling, I’ve successfully managed to add the ./docker-stats.py script to the sudoers file.
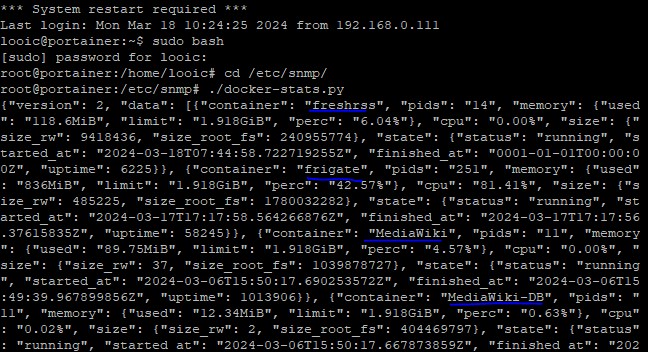
Now, the graphs show well for a container added this morning, but all other containers show up with NaN in the graph. Also, an output of the script shows that all data are correct.
{"version": 2, "data": [{"container": "freshrss", "pids": "14", "memory": {"used": "118.6MiB", "limit": "1.918GiB", "perc": "6.04%"}, "cpu": "0.00%", "size": {"size_rw": 9418436, "size_root_fs": 240955774}, "state": {"status": "running", "started_at": "2024-03-18T07:44:58.722719255Z", "finished_at": "0001-01-01T00:00:00Z", "uptime": 6405}}, {"container": "frigate", "pids": "251", "memory": {"used": "874.1MiB", "limit": "1.918GiB", "perc": "44.51%"}, "cpu": "159.06%", "size": {"size_rw": 485225, "size_root_fs": 1780032282}, "state": {"status": "running", "started_at": "2024-03-17T17:17:58.564266876Z", "finished_at": "2024-03-17T17:17:56.37615835Z", "uptime": 58426}}, {"container": "MediaWiki", "pids": "11", "memory": {"used": "89.75MiB", "limit": "1.918GiB", "perc": "4.57%"}, "cpu": "0.00%", "size": {"size_rw": 37, "size_root_fs": 1039878727}, "state": {"status": "running", "started_at": "2024-03-06T15:50:17.690253572Z", "finished_at": "2024-03-06T15:49:39.967899856Z", "uptime": 1014087}}, {"container": "MediaWiki-DB", "pids": "11", "memory": {"used": "12.34MiB", "limit": "1.918GiB", "perc": "0.63%"}, "cpu": "0.03%", "size": {"size_rw": 2, "size_root_fs": 404469797}, "state": {"status": "running", "started_at": "2024-03-06T15:50:17.667873859Z", "finished_at": "2024-03-06T15:49:39.420026597Z", "uptime": 1014087}}, {"container": "speedtest-tracker", "pids": "18", "memory": {"used": "57.52MiB", "limit": "1.918GiB", "perc": "2.93%"}, "cpu": "0.00%", "size": {"size_rw": 10727858, "size_root_fs": 319627898}, "state": {"status": "running", "started_at": "2024-03-06T15:50:17.420319635Z", "finished_at": "2024-03-06T15:49:43.505551812Z", "uptime": 1014087}}, {"container": "speedtest-tracker-db-1", "pids": "9", "memory": {"used": "11.4MiB", "limit": "1.918GiB", "perc": "0.58%"}, "cpu": "0.02%", "size": {"size_rw": 2, "size_root_fs": 403704283}, "state": {"status": "running", "started_at": "2024-03-06T15:50:17.38761643Z", "finished_at": "2024-03-06T15:49:39.377095882Z", "uptime": 1014087}}, {"container": "nginx-proxy-manager-app-1", "pids": "26", "memory": {"used": "53.56MiB", "limit": "1.918GiB", "perc": "2.73%"}, "cpu": "0.02%", "size": {"size_rw": 38947656, "size_root_fs": 882350272}, "state": {"status": "running", "started_at": "2024-03-06T15:50:17.479040021Z", "finished_at": "2024-03-06T15:49:43.611280385Z", "uptime": 1014087}}, {"container": "portainer", "pids": "7", "memory": {"used": "16.62MiB", "limit": "1.918GiB", "perc": "0.85%"}, "cpu": "0.00%", "size": {"size_rw": 0, "size_root_fs": 293624300}, "state": {"status": "running", "started_at": "2024-03-06T15:50:17.506543741Z", "finished_at": "2024-03-06T15:49:39.201517317Z", "uptime": 1014087}}], "error": "0", "errorString": ""}
Any idea ?