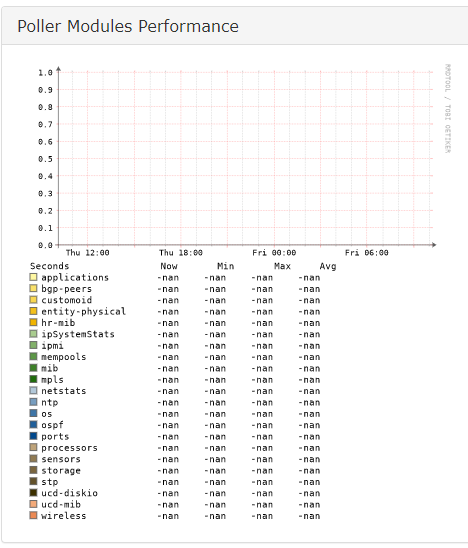
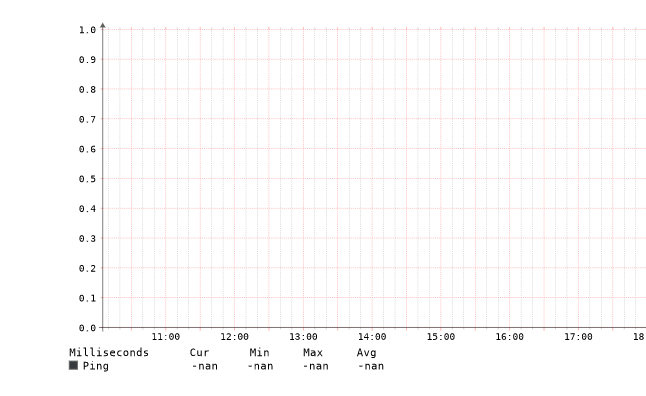
I’m running into issues where I’m getting -nan for my ping graphs. I’m running a distributed poller setup with rrdtool_version 1.7.0 and fast ping checks every 30s. My validate.php on both the poller and the main install check off fine, and I’ve confirmed that the graphs draw for some of the devices and fail for others.
Also potentially unrelated, but I noticed that if I add the device from the poller (via python3 snmp-scan.py to auto-scan subnets), it’ll only create the files in the /opt/librenms/rrd directory of the poller. However, if I add them on the main server, it’ll create the files on the main server’s rrd folder. It’s an issue because graphing fails when data isn’t on /opt/librenms/rrd of the main install. In distributed polling, is data written directly to the main server’s /opt/librenms/rrd directory or is it flushed from the poller’s /opt/librenms/rrd at some point in time? Is that expected functionality or is there something I can do to resolve this?
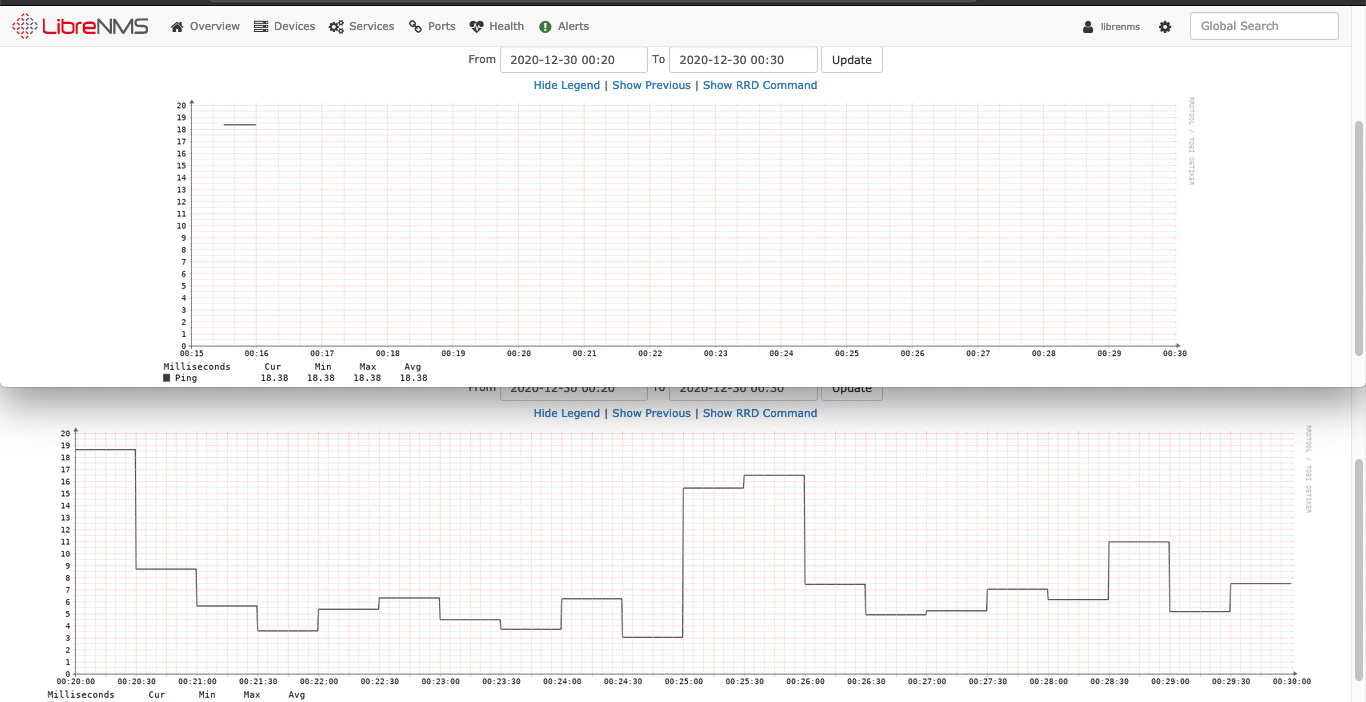
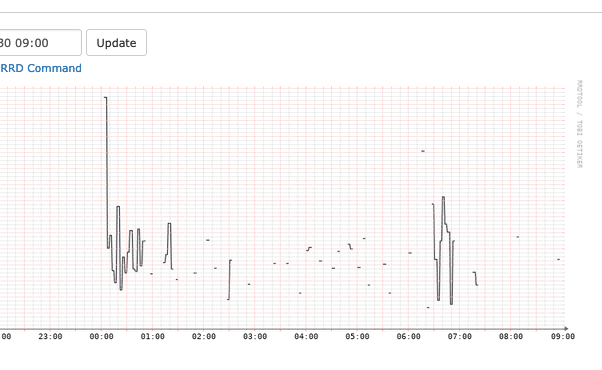
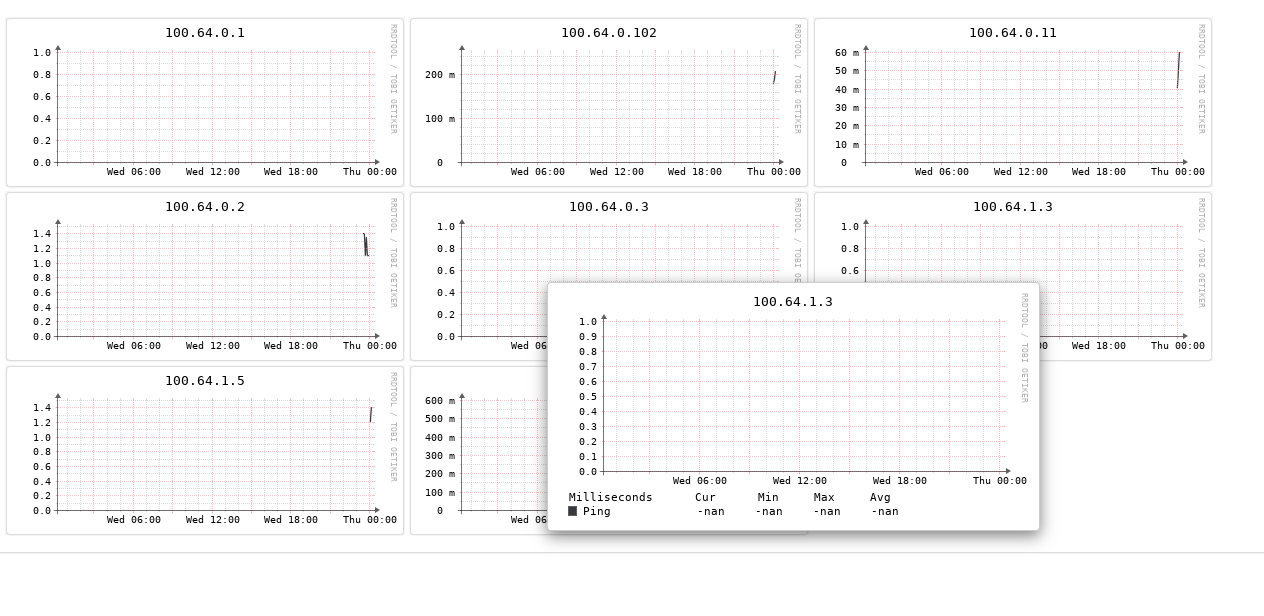
I confirmed that all the relevant directories are in /opt/librenms/rrd since I force-added on the main server. However, I’m seeing some ping graphs with nan entries.
This is the rrd command and output:
RRDTool Command

rrdtool graph /tmp/bRttCz6eiooYKFz4  -l 0 -E --start 1597810453 --end 1597896853 --width 1488 --height 300 -c BACK#EEEEEE00 -c SHADEA#EEEEEE00 -c SHADEB#EEEEEE00 -c CANVAS#FFFFFF00 -c GRID#a5a5a5 -c MGRID#FF9999 -c FRAME#5e5e5e -c ARROW#5e5e5e -R normal -c FONT#000000 --font LEGEND:8:DejaVuSansMono --font AXIS:7:DejaVuSansMono --font-render-mode normal DEF:ping=100.64.1.3/ping-perf.rrd:ping:AVERAGE 'COMMENT:Milliseconds      Cur      Min     Max     Avg\n' LINE1.25:ping#36393d:Ping GPRINT:ping:LAST:%14.2lf  GPRINT:ping:AVERAGE:%6.2lf GPRINT:ping:MAX:%6.2lf  'GPRINT:ping:AVERAGE:%6.2lf\n' --daemon localhost:42217
RRDTool Output

1569x369
OK u:0.04 s:0.01 r:0.05
Any idea what might be going on here?
UPDATE
I went ahead and deleted the existing ping-perf.rrd files for the problematic devices and re-ran polling for the same devices. It seemed to resolve the issue (for now), but I’d still like some insight on how the ping-perf.rrd files got into a bad state in the first place.