So, I’m not a very experienced rrdtool user, and I may be asking a really dumb question. but can someone explain this to me;
I was under the assumption that these show the Total data transferred for one port on a device that I just added to librenms a few hours ago. It gets this data through snmp from a mikrotik router. I have no idea how often it receives data from its I/O traffic over this port, but my question would then be;
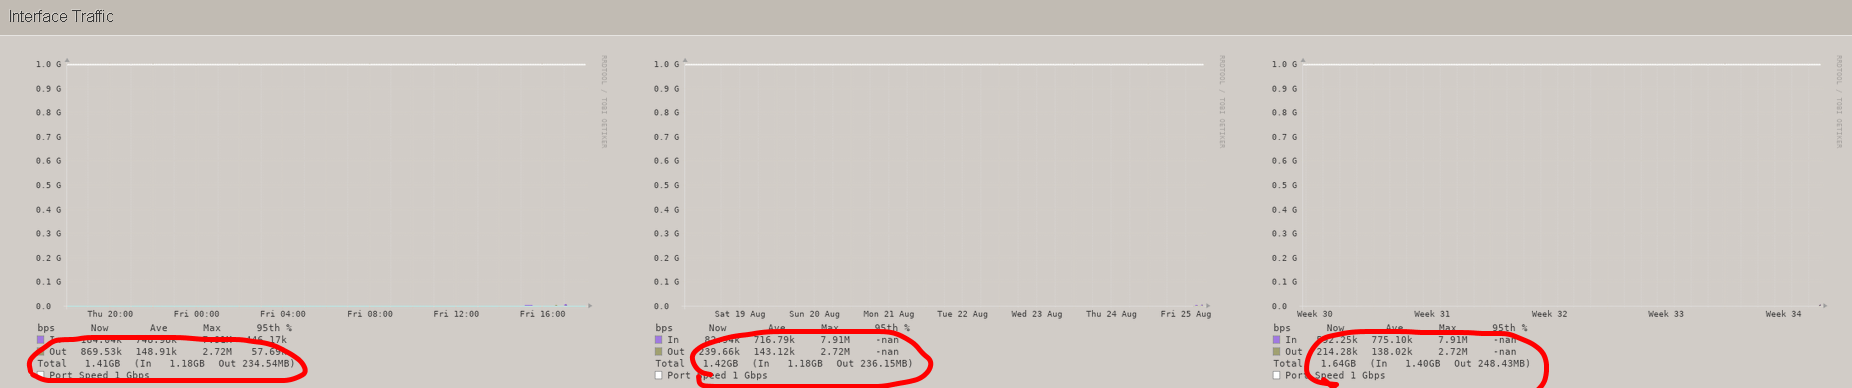
How can a day, week, month read-out of traffic flow data even differ, while the device just appeared today? Please, can someone experienced in rrdtool tell me in laymen’s terms why these are different? Especially illogical is how the week graph shows a lower total than the day graph(?), and the month graph shows a higher total(??).
Anyone? Thanks in advance!