Hello
Do graphs get less accurate over time? For example after 1 month it seems to go to 1 hour averaging from 5 minutes.
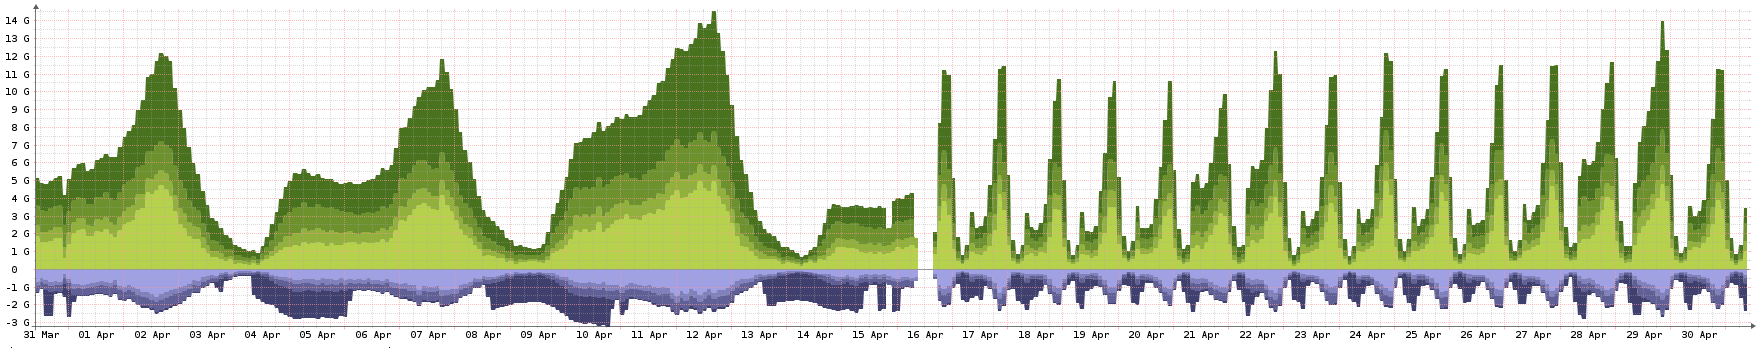
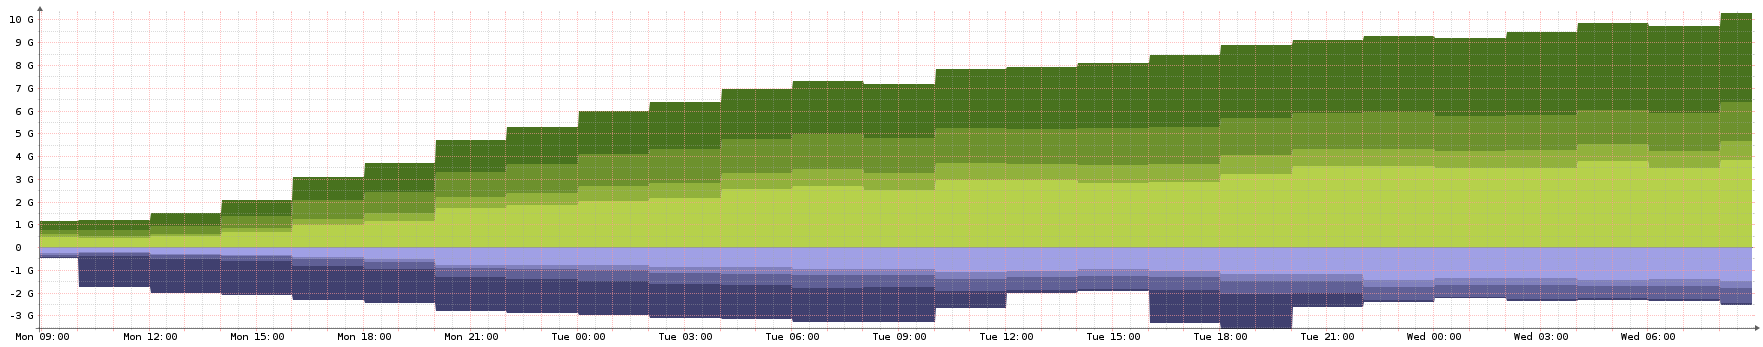
If i zoom in to a day two months ago it seems to do 3 hour averaging:
Thanks!
Hello
Do graphs get less accurate over time? For example after 1 month it seems to go to 1 hour averaging from 5 minutes.
If i zoom in to a day two months ago it seems to do 3 hour averaging:
Thanks!
Hello
Yes, they do.
The way monitoring systems usually graph is using a “fix size” to store each source of data. This is exactly how RRDTool works when storing and graphing the values. You should probably have a look at https://oss.oetiker.ch/rrdtool/ and https://en.wikipedia.org/wiki/RRDtool .
Bye
PipoCanaja