Guys,
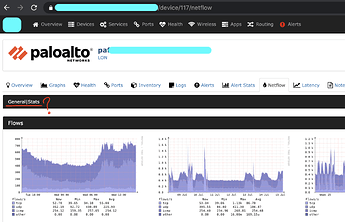
I don’t know when but something has changed in the Netflow tab:
I noticed that the information in the top section has disappeared and the links don’t work: the tab goes to address https://hostname/device/id/netflow
but the links point to
https://hostname/device/device=id/tab=nfsen/nfsen=stats/ which of course does not work.
The graphs work as before.
Were you able to find any fix to this? I just enabled netflow in my instance and the same issue occurs.
I never had it working. Setup an NFSEN instance, exported the directories from the NFSEN box. Modified FSTAB to mount the DIRS on librenms box. Modified config on librenms box. Added pointer for the host. I get the netflow tab for the host in libre but nothing more. On the NFSEN box I get the graphs and data.
No, it’s like this.
I suppose someone made an update and forgot this part.
@murrant
followed your link and from what I gather the latest version of LibreNMS broke the nfsen integration and your commit fixes it? I tried `./scripts/github-apply <pr_id> but I guess I don’t know what the pr_id is or even where to find it =(
It is already merged, just run ./daily.sh (or wait a day or two)
It only fixes the links, it has been broken for 2 versions 
Also, PR ID is in the link and displayed prominently on the pull request page.
thank you for the fast response. I’m guessing the pr_id is 11971 and I get error: unrecognized input when I try to run it. No big deal…Linux beginner here and trying to learn as much as I can banging on this stuff.
I’ll try to run a daily for the next few days and see if it makes any difference for my issue, fingers crossed.
running the July 30th, 2020 release of LibreNMS and still no love for me with my nfsen integration. NFSEN box is collecting and displaying data, libre isn’t displaying it. If anyone has any ideas, I’d really appreciate it.
On the nfsen box I have exported the RRD path along with the nfsen path. I have these mounted on my librenms box under /media/
My config looks like this:
##########NFSEN##############
$config[‘nfsen_enable’] = 1;
$config[‘nfsen_split_char’] = ‘_’;
$config[‘nfsen_base’][] = ‘/media/nfsen/’;
$config[‘nfsen_rrds’][] = ‘/media/nfsen/profiles-stat/live/’;
$config[‘nfsen_rrds’][] = ‘/media/nfsen/profiles-stat’;
$config[‘nfdump’] = ‘/media/nfdump/nfdump’;
$config[‘nfsen_last_max’] = 153600;
$config[‘nfsen_top_max’] = 500;
$config[‘nfsen_top_N’]=array( 10, 20, 50, 100, 200, 500 );
$config[‘nfsen_top_default’]=20;
$config[‘nfsen_stat_default’]=‘srcip’;
$config[‘nfsen_order_default’]=‘packets’;
I had a few minutes to play with this some more. Just for fun I copied the mounted “/media/nfsen” to /opt/nfsen" (local disk on my librenms instance). Changed my config.php, restarted nginx and still no graphs. However; if I click on stats, I get data. Then I wondered if I was getting data under stats using the mounted path…and I am…just no graphs for some reason.
Top 20 IP Addr ordered by packets:
Date first seen Duration Proto IP Addr Flows(%) Packets(%) Bytes(%) pps bps bpp
2020-07-31 13:55:00.028 899.738 any 10.12.1.54 4454(27.8) 3.4 M(27.8) 900.4 M(16.6) 3801 8.0 M 263
2020-07-31 13:55:00.028 899.249 any 10.11.6.100 2464(15.4) 1.9 M(15.4) 343.4 M( 6.3) 2104 3.1 M 181
2020-07-31 13:55:00.028 899.738 any 10.11.6.101 2297(14.3) 1.8 M(14.3) 163.1 M( 3.0) 1960 1.5 M 92
2020-07-31 13:55:02.775 896.502 any 10.11.6.50 1580( 9.9) 1.2 M( 9.9) 859.4 M(15.8) 1353 7.7 M 708
2020-07-31 13:55:00.708 893.834 any 10.12.1.51 1178( 7.3) 904704( 7.3) 261.4 M( 4.8) 1012 2.3 M 288
2020-07-31 13:55:02.775 896.502 any 10.11.6.236 1148( 7.2) 881664( 7.2) 783.2 M(14.4) 983 7.0 M 888
2020-07-31 13:55:00.028 876.703 any 10.11.61.125 540( 3.4) 414720( 3.4) 265.5 M( 4.9) 473 2.4 M 640
2020-07-31 13:55:13.225 886.052 any 10.11.10.14 530( 3.3) 407040( 3.3) 333.3 M( 6.1) 459 3.0 M 818
2020-07-31 13:55:00.028 899.738 any 10.11.19.170 495( 3.1) 380160( 3.1) 214.1 M( 3.9) 422 1.9 M 563
2020-07-31 13:57:19.184 664.178 any 10.31.31.4 483( 3.0) 370944( 3.0) 407.3 M( 7.5) 558 4.9 M 1097
2020-07-31 13:55:00.028 899.249 any 10.33.12.241 397( 2.5) 304896( 2.5) 115.5 M( 2.1) 339 1.0 M 378
2020-07-31 13:55:04.478 891.992 any 10.11.6.3 394( 2.5) 302592( 2.5) 304.0 M( 5.6) 339 2.7 M 1004
2020-07-31 13:55:18.071 875.740 any 10.31.230.14 367( 2.3) 281856( 2.3) 109.3 M( 2.0) 321 998822 387
2020-07-31 13:55:03.790 892.680 any 10.11.6.20 346( 2.2) 265728( 2.2) 112.4 M( 2.1) 297 1.0 M 422
2020-07-31 13:55:36.480 858.062 any 10.11.61.84 342( 2.1) 262656( 2.1) 135.9 M( 2.5) 306 1.3 M 517
2020-07-31 13:55:09.000 885.542 any 10.11.6.151 322( 2.0) 247296( 2.0) 182.3 M( 3.4) 279 1.6 M 737
2020-07-31 13:55:09.000 885.542 any 10.11.6.7 314( 2.0) 241152( 2.0) 181.8 M( 3.3) 272 1.6 M 753
2020-07-31 13:55:03.327 846.756 any 10.11.61.50 283( 1.8) 217344( 1.8) 112.2 M( 2.1) 256 1.1 M 516
2020-07-31 13:55:00.028 899.738 any 10.11.61.15 281( 1.8) 215808( 1.8) 87.2 M( 1.6) 239 775359 404
2020-07-31 13:55:06.446 889.793 any 10.31.61.61 250( 1.6) 192000( 1.6) 70.3 M( 1.3) 215 632419 366
Summary: total flows: 16032, total bytes: 5432795136, total packets: 12312576, avg bps: 48305574, avg pps: 13684, avg bpp: 441
Time window: 2020-07-31 13:55:00 - 2020-07-31 14:09:59
Total flows processed: 16032, Blocks skipped: 0, Bytes read: 1026576
Sys: 0.012s flows/second: 1294991.9 Wall: 0.009s flows/second: 1615314.9

