I updated from version 21.6.0 to 22.6.0, and noticed a poller module is now included for availability.
-
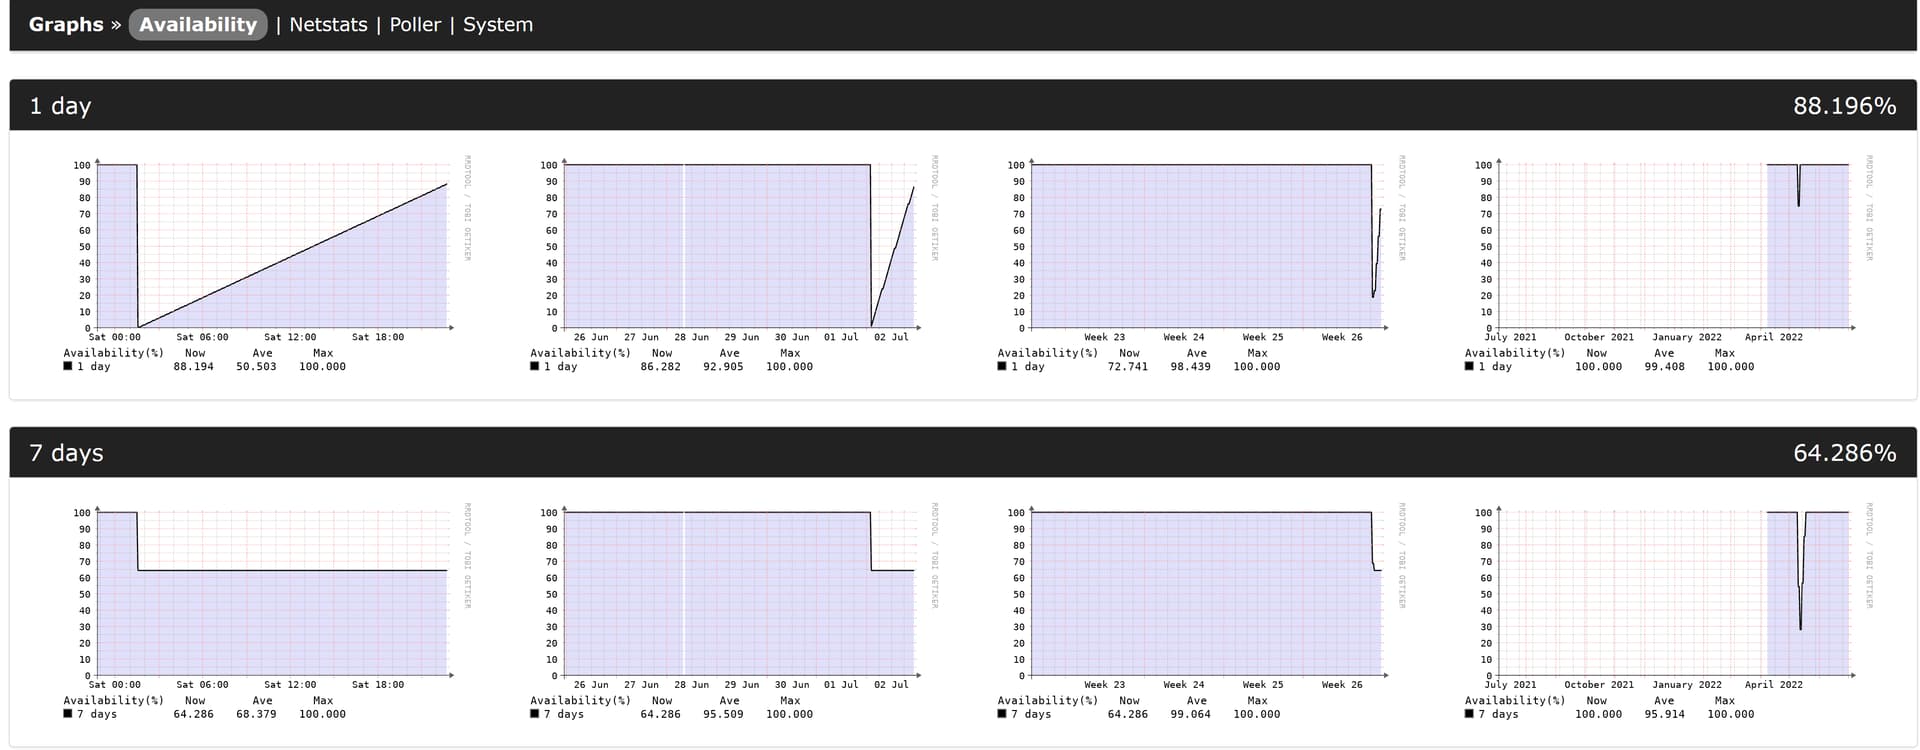
I unchecked the ‘availability’ poller module at a device’s level under the edit → modules option and ran ‘rediscover’ device, then noticed availability value of ‘0’ is being graphed - causing an overall negative value for device availability
-
Then I checked the ‘availability’ poller module at a device’s level under the edit → modules option and ran ‘rediscover’ device, still noticed no difference for a few hours now - availability value of ‘0’ is being graphed - causing an overall negative value for device availability.
-
For other devices, availability value improved either shortly after the update or about 12 hours after
-
Hostname of the device was updated on the device 10 minutes after the LibreNMS update and not sure if this caused the issue,
The device is online and has an uptime of 288+ days
Here is the output of ./validate.php:
| Component | Version |
|---|---|
| LibreNMS | 22.6.0 |
| DB Schema | 2022_05_30_084932_update-app-status-length (242) |
| PHP | 7.3.31-1~deb10u1 |
| Python | 3.7.3 |
| MySQL | 10.3.34-MariaDB-0+deb10u1 |
| RRDTool | 1.7.1 |
| SNMP | 5.7.3 |
| ==================================== |
[OK] Composer Version: 2.3.7
[OK] Dependencies up-to-date.
[OK] Database connection successful
[OK] Database Schema is current
[OK] SQL Server meets minimum requirements
[OK] lower_case_table_names is enabled
[OK] MySQL engine is optimal
[OK]
[OK] Database schema correct
[OK] MySQl and PHP time match
[OK] rrdtool version ok
[OK] Connected to rrdcached
Browser is Firefox version 102.0 (64-bit)
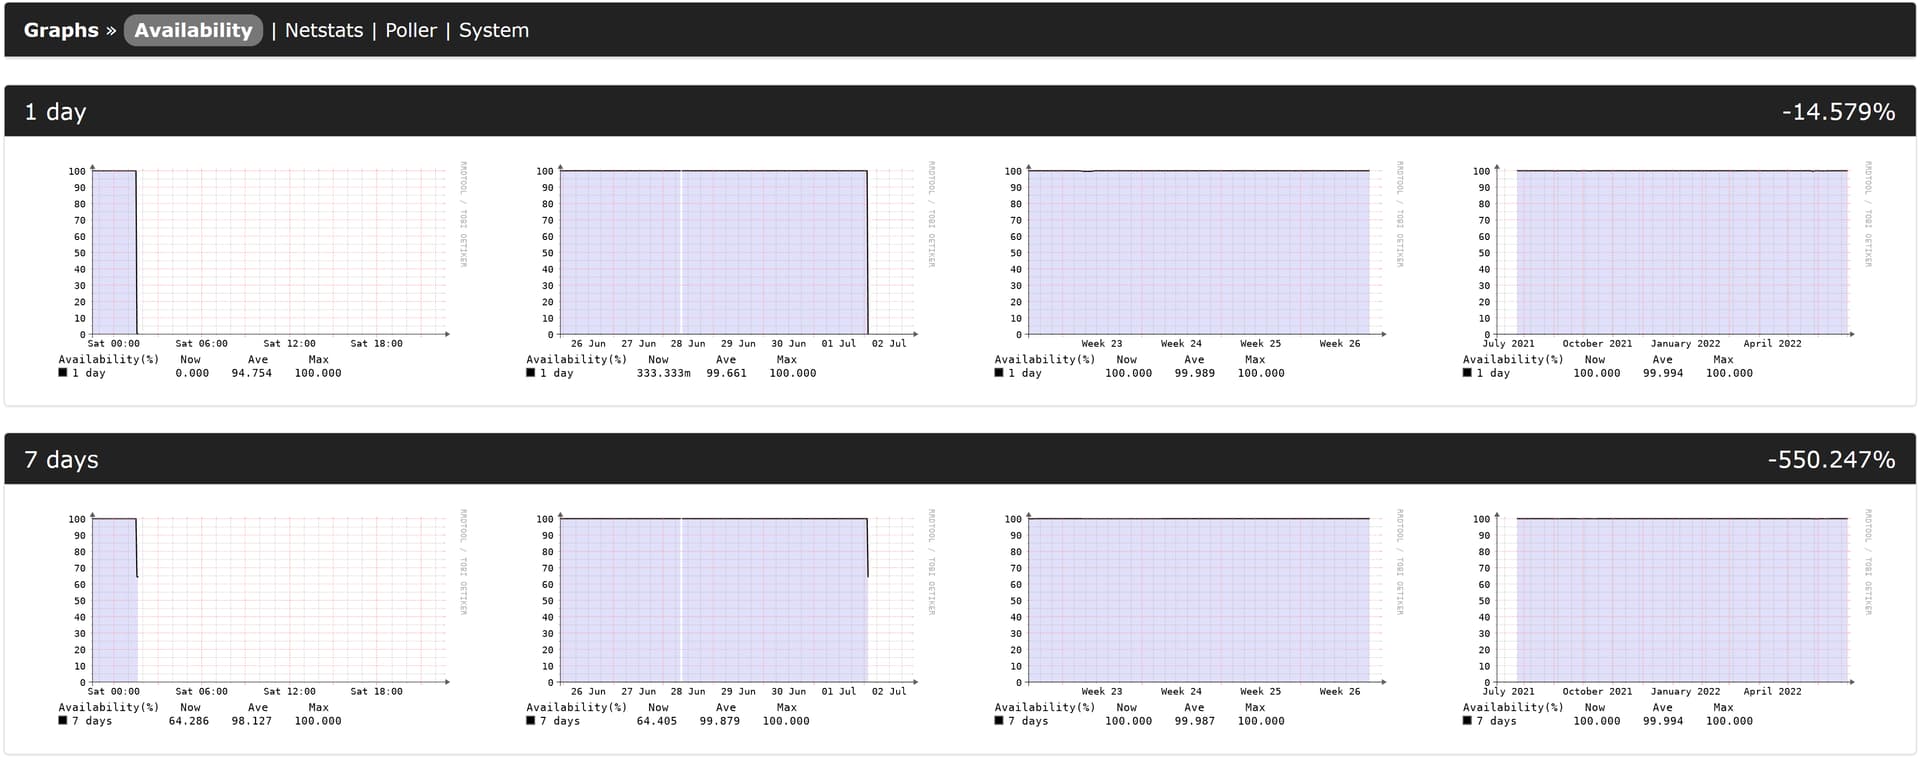
Screenshot of image with incorrect data
output of: ./poller.php -h 6 -v -m availability
LibreNMS Poller
Version info:
Commit SHA: 3724aaa836722088a600758c829fb612519c22eb
Commit Date: 1655261622
DB Schema: 2022_05_30_084932_update-app-status-length (242)
PHP: 7.3.31-1~deb10u1
MySQL: 10.3.34-MariaDB-0+deb10u1
RRDTool: 1.7.1
SNMP: 5.7.3
==================================DEBUG!
Starting polling run:
Hostname: 10.0.4.1
Device ID: 6
OS: slms
RRDtool Output: 1656798540
OK u:0.01 s:0.00 r:1.05
RRDtool Output:
Load poller module core
RRDtool Output: 1656798300
OK u:0.01 s:0.00 r:1.12
RRDtool Output: OK u:0.00 s:0.01 r:1.05
Uptime: 288 days 21 hours 18 minutes 53 seconds
Runtime for poller module ‘core’: 0.0652 seconds with 71216 bytes
SNMP: [2/0.06s] MySQL: [1/0.00s] RRD: [2/0.00s]
Unload poller module core
RRDtool Output: 1656798300
OK u:0.01 s:0.00 r:1.12
RRDtool Output: OK u:0.00 s:0.01 r:1.12
Load poller module availability
Availability:
RRDtool Output: 1656798300
OK u:0.01 s:0.00 r:1.12
RRDtool Output: OK u:0.00 s:0.01 r:1.12
1 day : -3.569%
RRDtool Output: 1656798300
OK u:0.01 s:0.00 r:1.12
RRDtool Output: OK u:0.00 s:0.01 r:1.12
7 days : -548.871%
RRDtool Output: 1656798300
OK u:0.01 s:0.00 r:1.12
RRDtool Output: OK u:0.00 s:0.01 r:1.12
30 days : -588.081%
RRDtool Output: 1656798300
OK u:0.01 s:0.00 r:1.13
RRDtool Output: OK u:0.00 s:0.01 r:1.12
365 days : -338.804%
Runtime for poller module ‘availability’: 0.0062 seconds with 13344 bytes
SNMP: [0/0.00s] MySQL: [10/0.03s] RRD: [10/0.00s]
Unload poller module availability
RRDtool Output: 1656798300
OK u:0.01 s:0.00 r:1.13
RRDtool Output: OK u:0.00 s:0.01 r:1.12
RRDtool Output: 1656798300
OK u:0.01 s:0.00 r:1.13
RRDtool Output: OK u:0.00 s:0.01 r:1.13
Polled in 1.13 seconds
Start Device Groups
End Device Groups, runtime: 0.0121s
Start Alerts
Rule #2 (SNMP not Responding on Device - Device Marked Down):
Status: NOCHG
Rule #3 (Device Rebooted):
Status: NOCHG
Rule #6 (Ping Latency Observed):
Status: NOCHG
Rule #7 (Port Utilisation over Threshold - Amber Alert):
Status: NOCHG
Rule #9 (Port Utilisation over Threshold - Red Alert):
Status: NOCHG
Rule #11 (High Processor Utilisation - Red Alert):
Status: NOCHG
Rule #12 (High Processor Utilisation - Amber Alert):
Status: NOCHG
Rule #13 (Authentication Failure):
Status: NOCHG
Rule #16 (OLT - Downlink Port Down):
Status: SKIP
Rule #17 (Device Configuration Modified):
Status: NOCHG
Rule #30 (Device Unreachable - No ICMP response):
Status: NOCHG
Rule #33 (ONU Manually Rebooted):
Status: NOCHG
Rule #35 (OLT - ZMS Configuration Sync Issue):
Status: NOCHG
Rule #36 (ONT Configuration Failed):
Status: NOCHG
Rule #38 (Rouge ONU Detection Initiated):
Status: NOCHG
Rule #39 (OLT - Bridge Loop Detected):
Status: NOCHG
Rule #40 (OLT - Chassis Temperature Threshold Exceeded):
Status: NOCHG
Rule #41 (OLT - Link Aggregation Down):
Status: NOCHG
Rule #43 (OLT - Ethernet Uplink Port Down):
Status: NOCHG
Rule #44 (OLT - Line Card Reset):
Status: NOCHG
Rule #45 (OLT - Management Card Reset):
Status: NOCHG
Rule #46 (OLT - Fabric Card Reset):
Status: NOCHG
Rule #48 (High Memory Utilisation - Amber Alert):
Status: NOCHG
Rule #51 (High Memory Utilisation - Red Alert):
Status: NOCHG
Rule #60 (OLT - Slot Reboot):
Status: NOCHG
Rule #66 (ONT - Bridge Packet Storm Detected):
Status: NOCHG
Rule #67 (ONT - Rx Power Out of Range):
Status: NOCHG
Rule #68 (PON ONU Down - ONT Status Inactive):
Status: NOCHG
End Alerts
SNMP [3/0.10s]: Snmpget[3/0.10s]
SQL [107/0.46s]: Select[100/0.44s] Insert[1/0.01s] Update[6/0.02s]
RRD [18/0.00s]: Other[9/0.00s] Update[9/0.00s]
Please can anyone help me diagnose and resolve the issue causing ‘0’ avaialbility stats for the device in the graph.
Many thanks