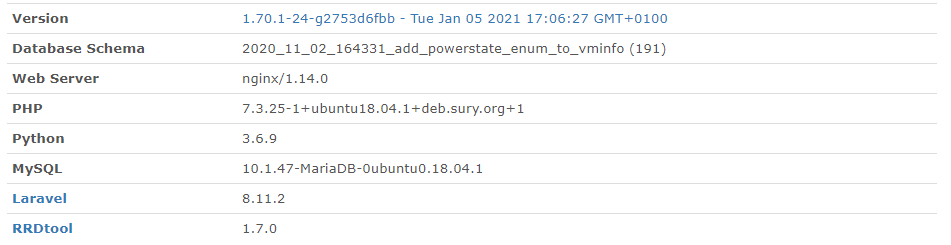
This is our version of the LibreNMS server
When i add a new device there is a connection with the Mikrotik routers, it get information from out the Mikrotik (log etc) but we see no graphs anymore.
First we thought is has something to do with the new Mikrotik Router OS but when we upgrade devices which are working correct the graphs will continue.
Does anyone knows what is changed ? Or has anyone an idea what we can do to get the Graphs back in the new devices?
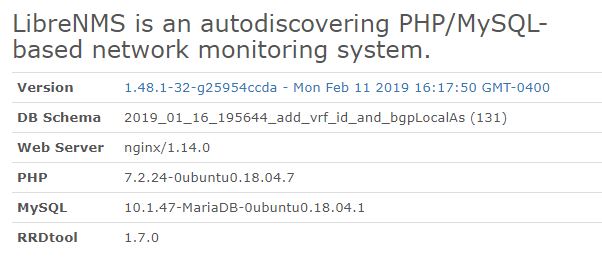
LibreNMS is an autodiscovering PHP/MySQL-based network monitoring system.
| Version | 1.48.1-32-g25954ccda - Mon Feb 11 2019 16:17:50 GMT-0400 |
|---|---|
| DB Schema | 2019_01_16_195644_add_vrf_id_and_bgpLocalAs (131) |
| Web Server | nginx/1.14.0 |
| PHP | 7.2.24-0ubuntu0.18.04.7 |
| MySQL | 10.1.47-MariaDB-0ubuntu0.18.04.1 |
| RRDtool | 1.7.0 |