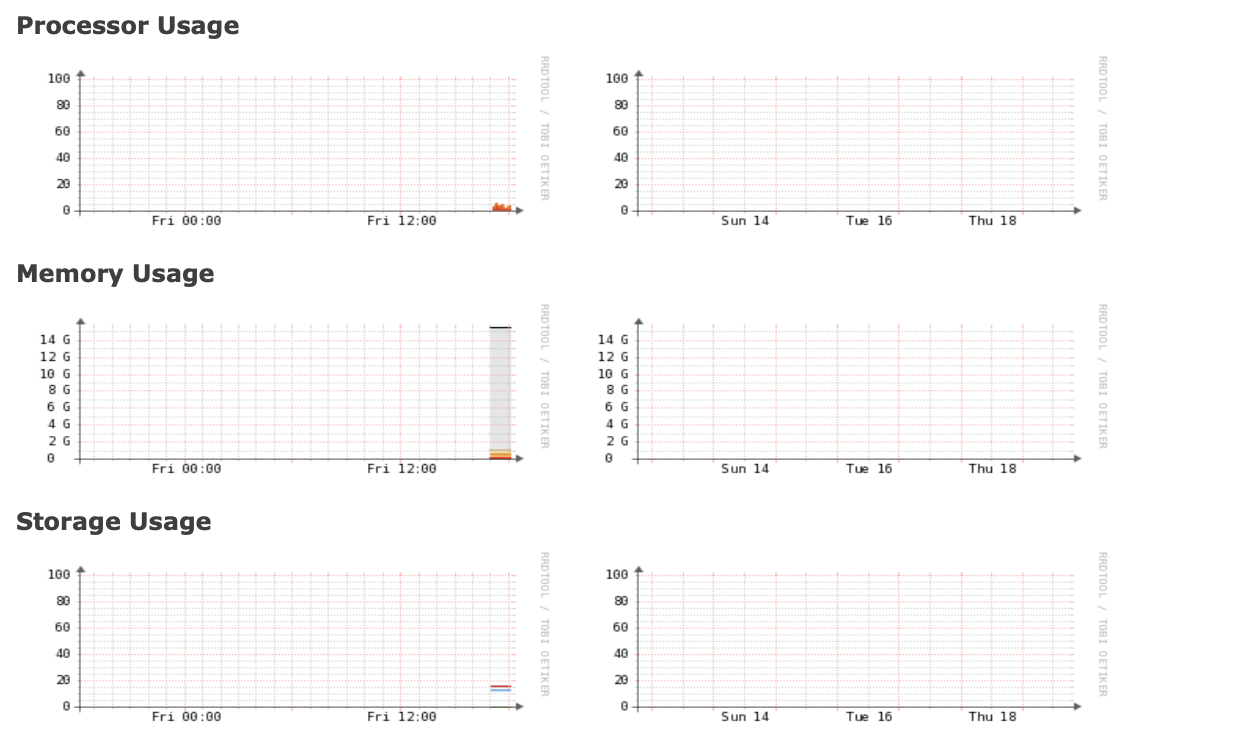
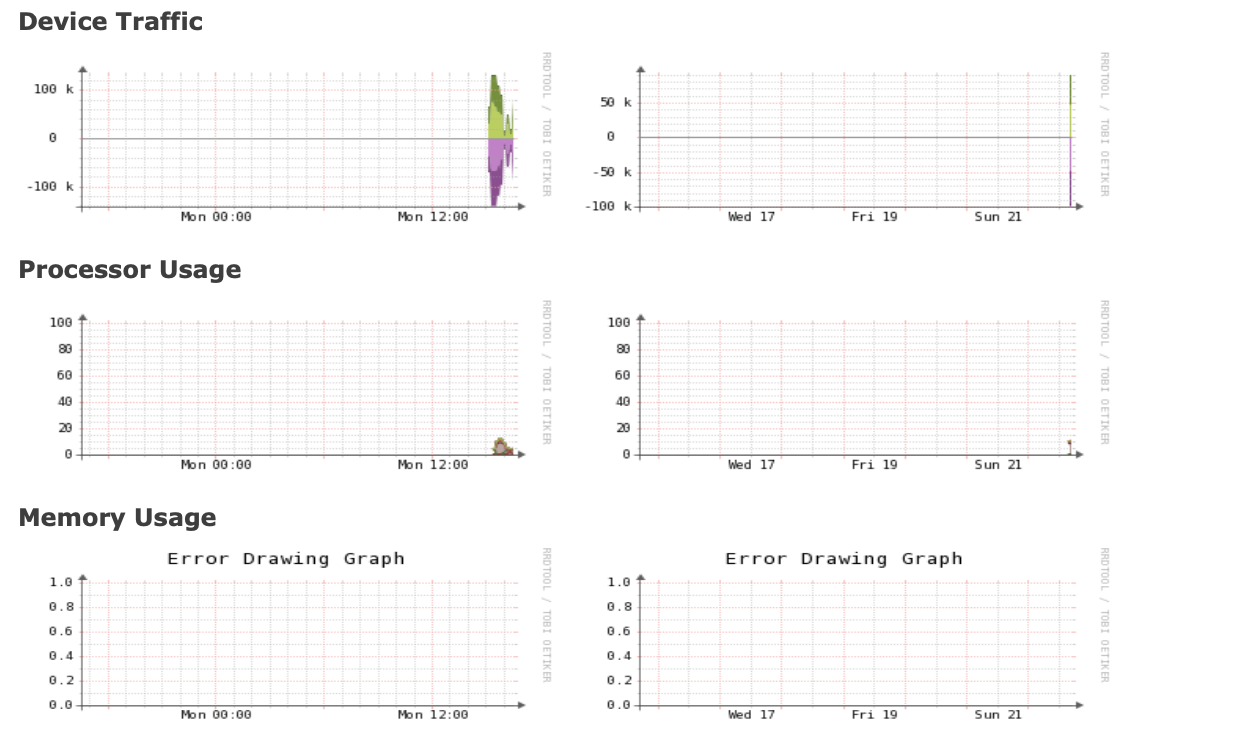
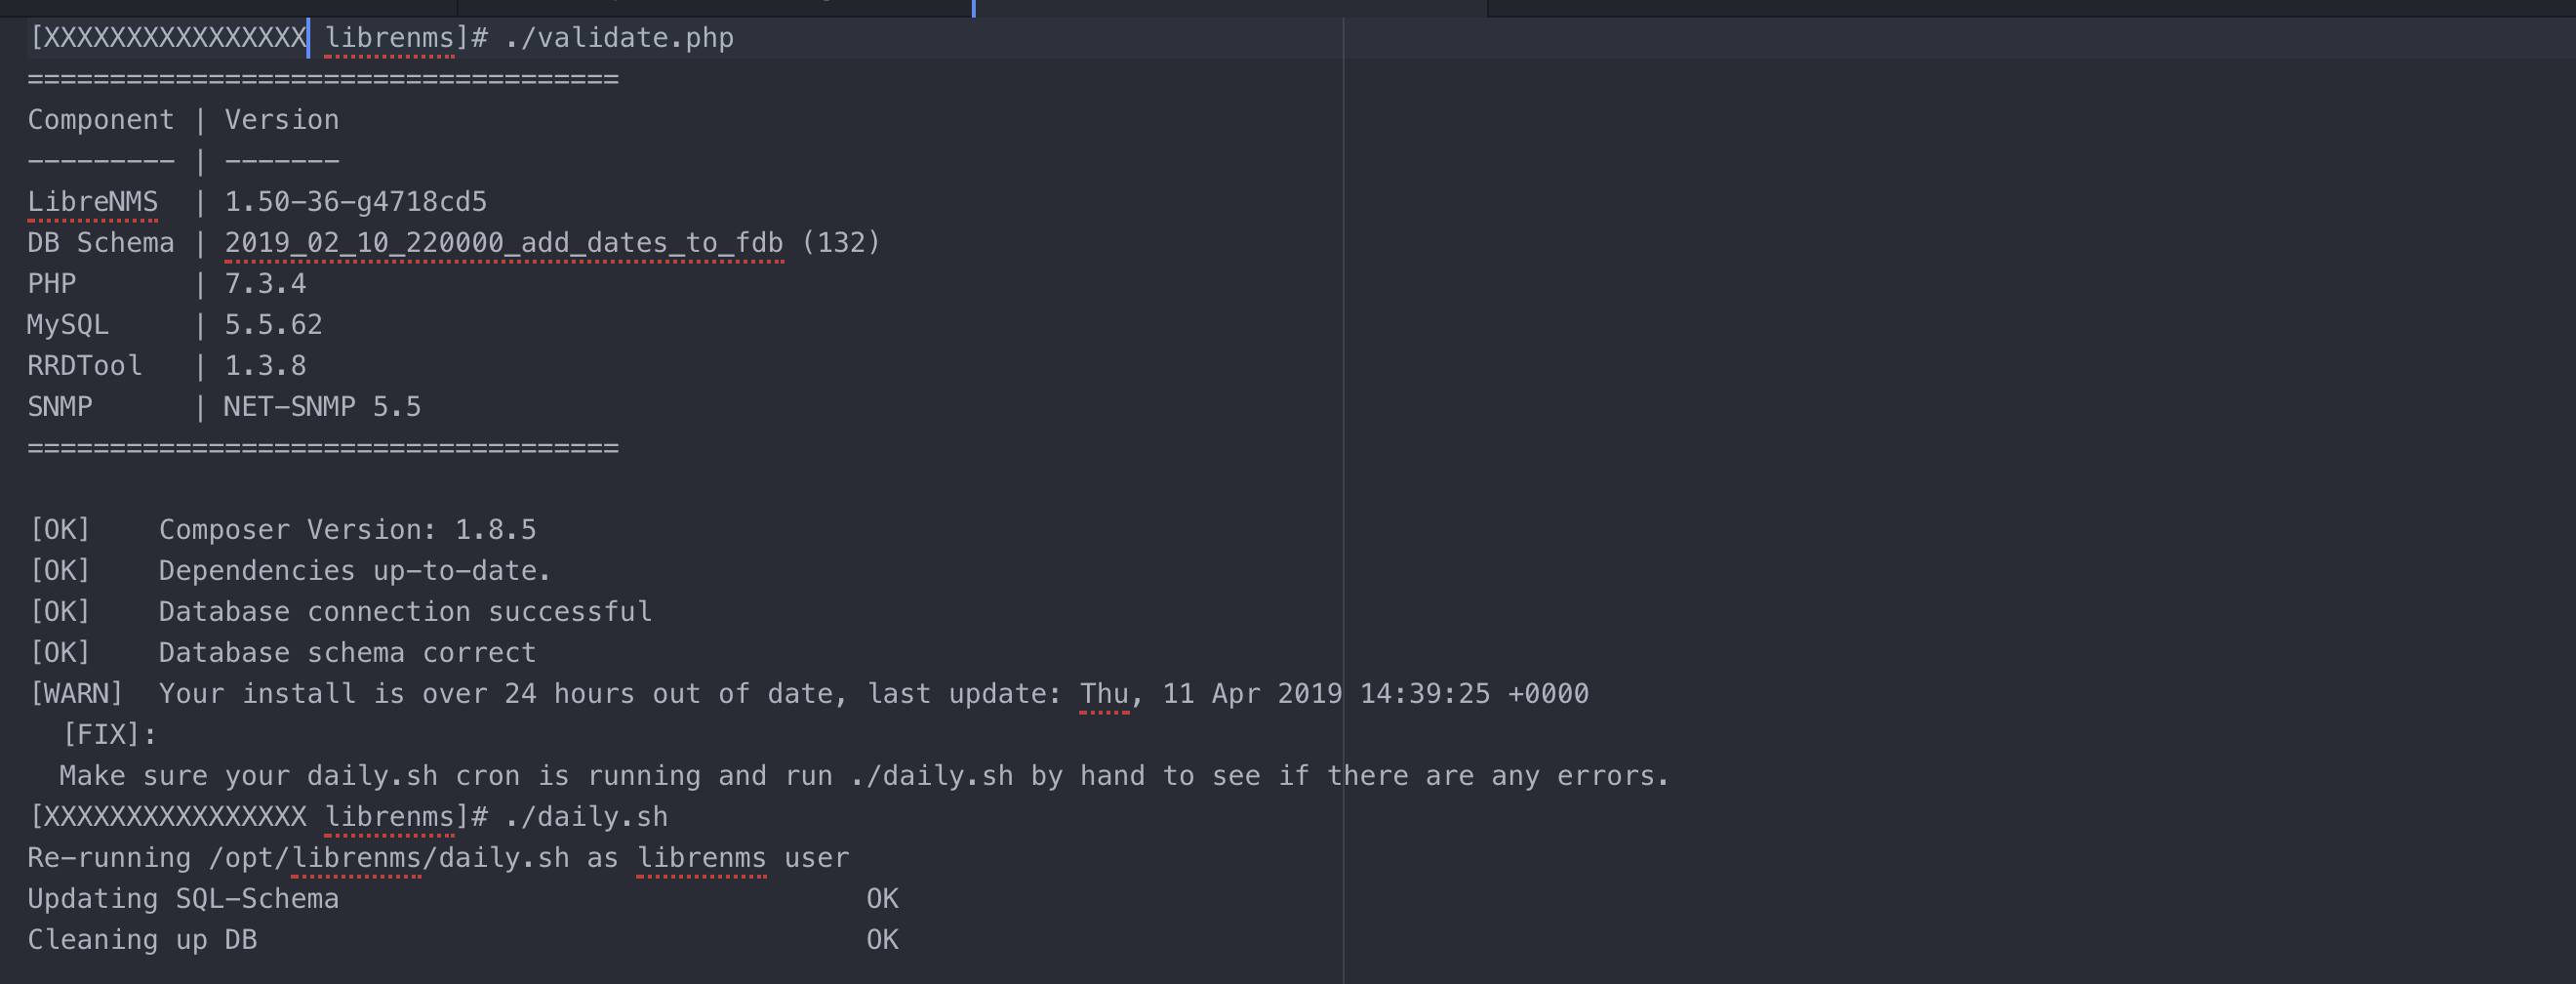
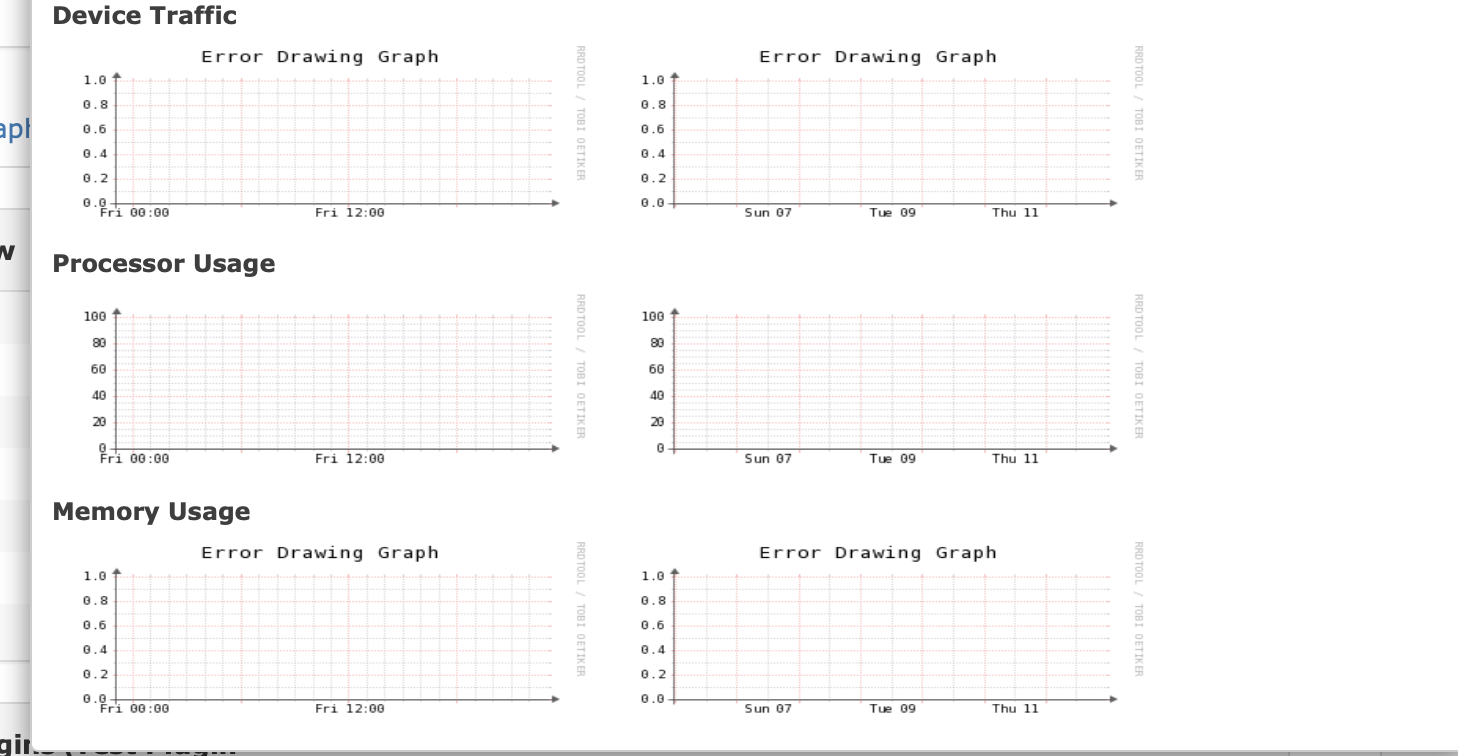
I installed librenms on Red Hat Enterprise Linux Server release 6.10 (Santiago), I configured snmp on my Vyatta’s and added couple of devices, I can see the devices with the OS version and showed the up/down for few hours, but I can not see any data for the devices. I ran ./validate.php and ./daily.sh with no issue. Attaching the screenshot. Any suggestions please
I found the issue, had to install memcached and started seeing graphs. Now how can I clear memory usage and Device traffic please?
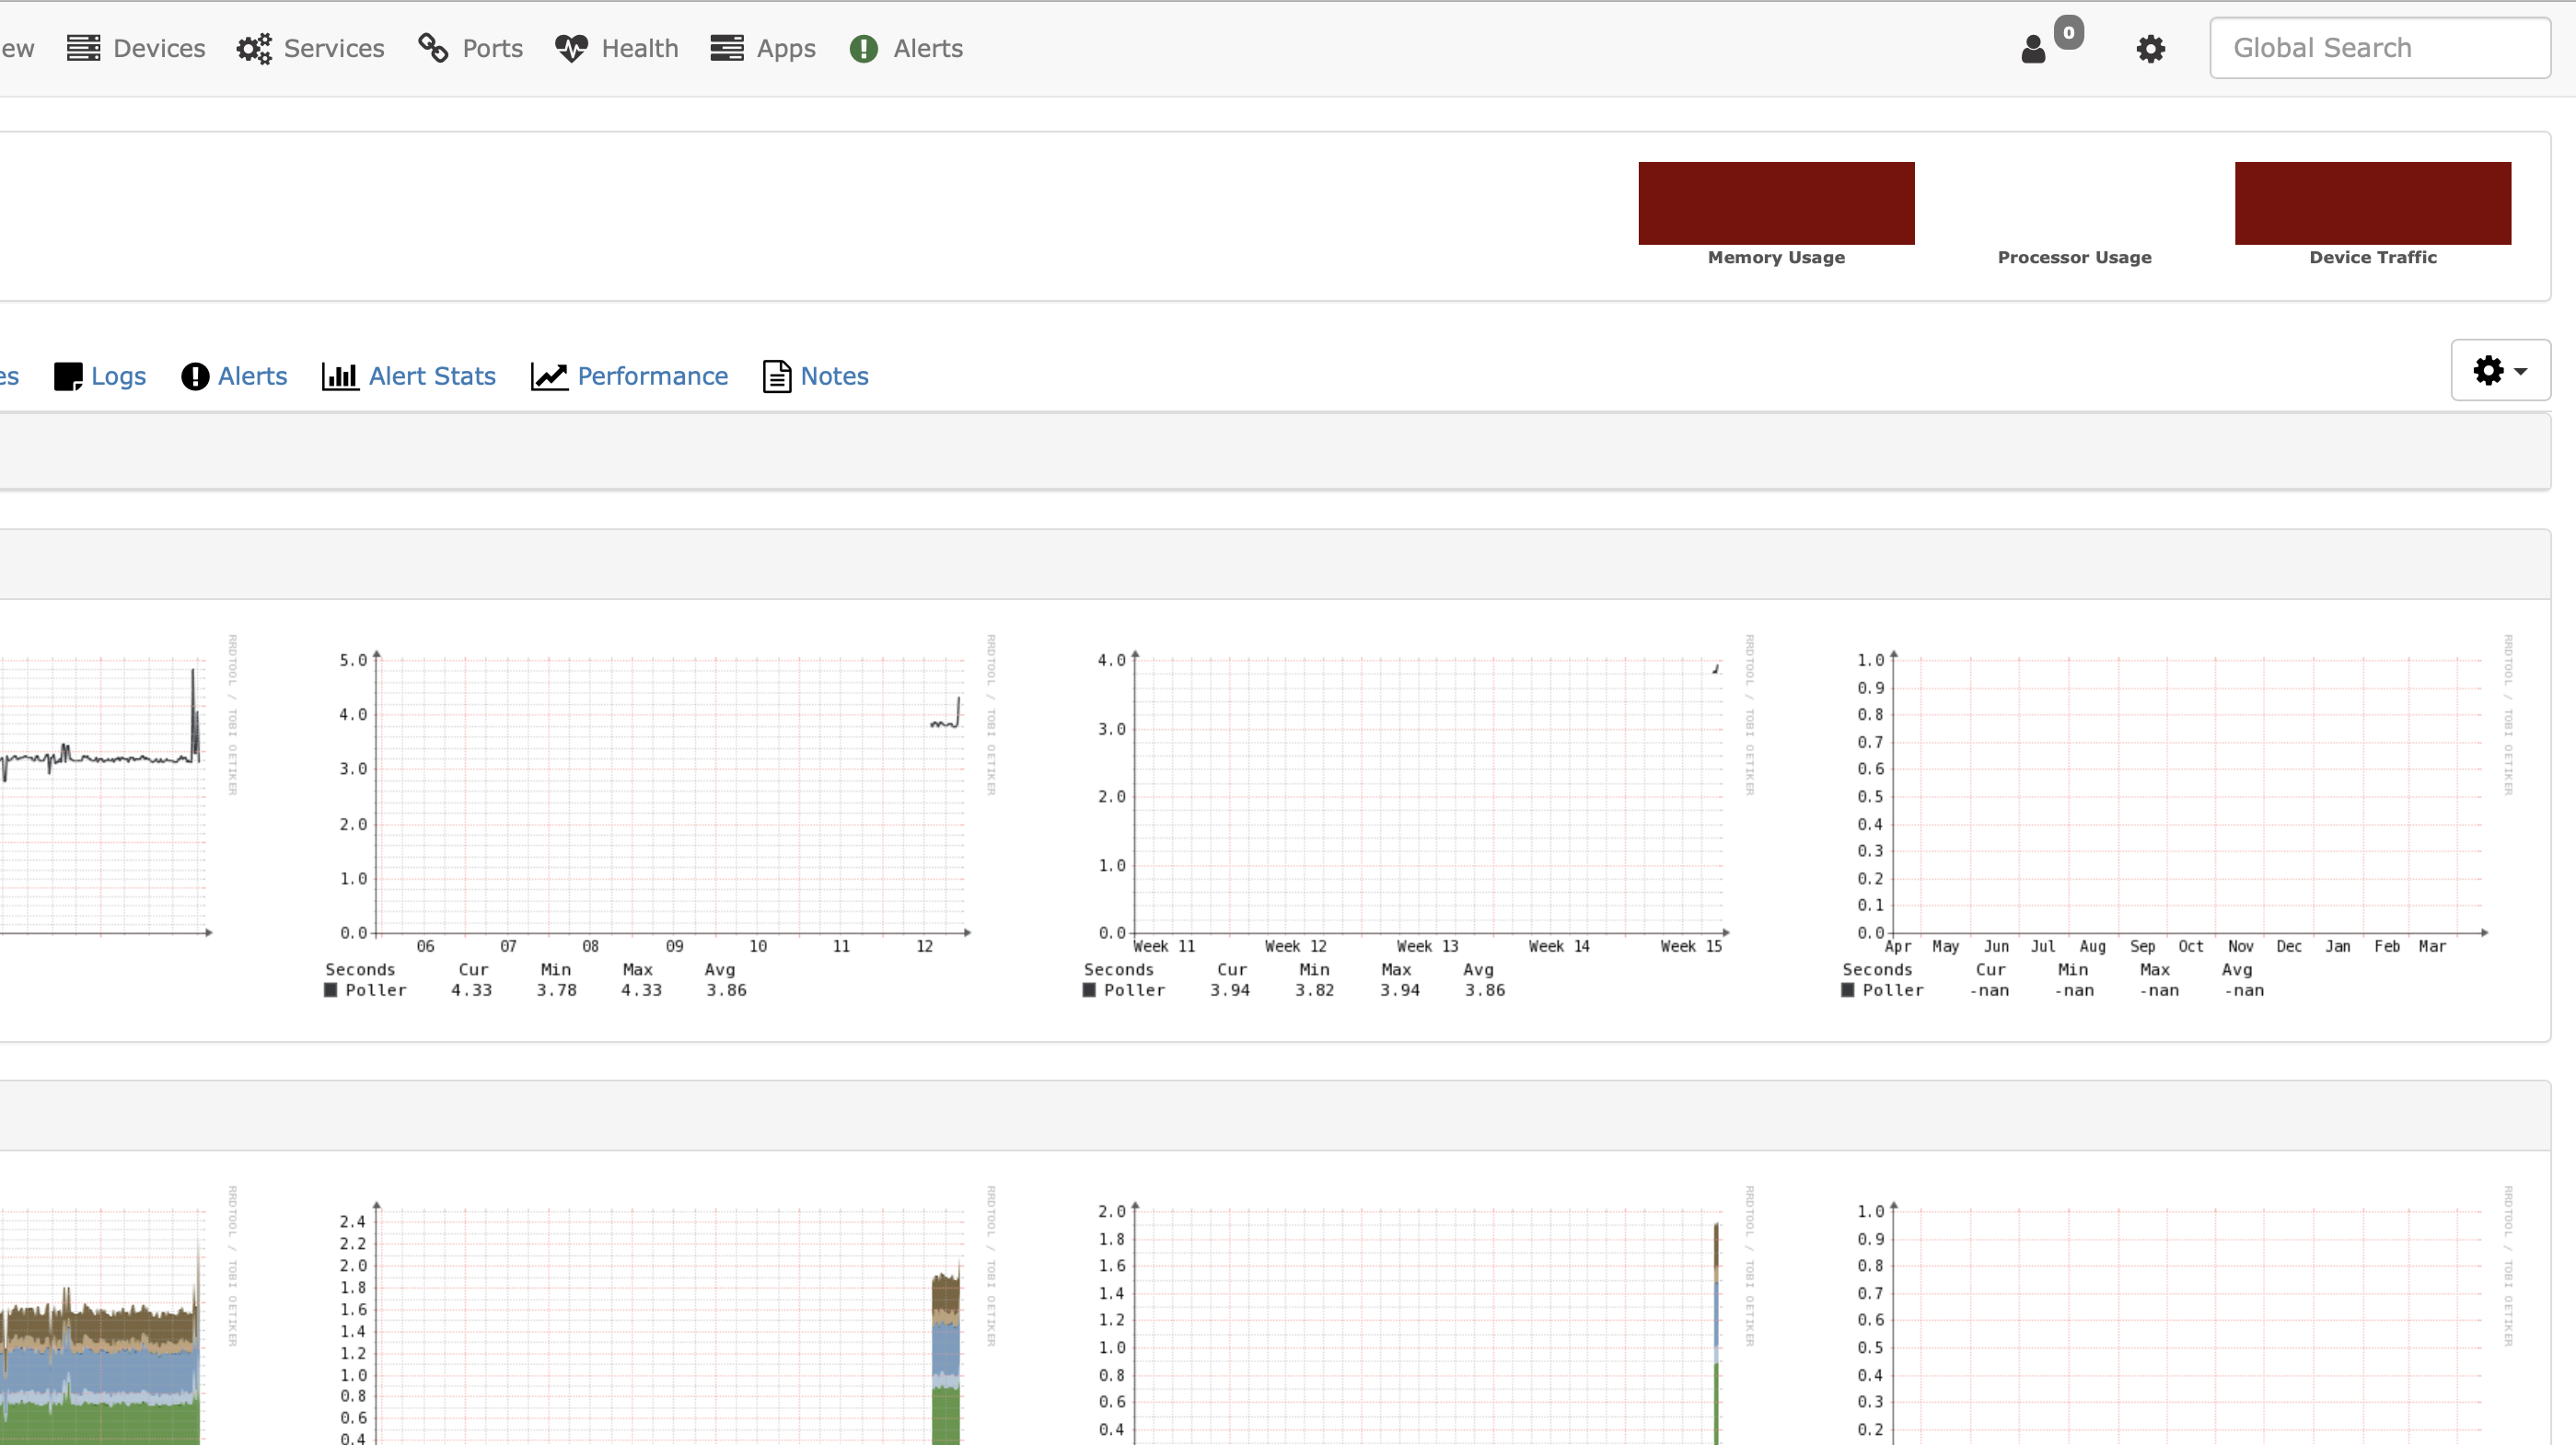
Try adding localhost as a device, do those graphs populate ?
i would look at upgrading RRDTool it’s quite an old version your using.
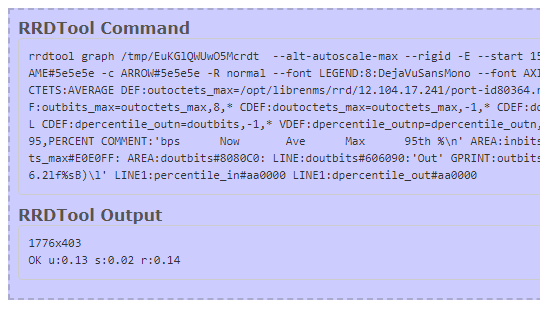
Click on an errored graph -> show rrd command and post output
Is selinux enforcing?
@Chas sorry for the delay. Attaching one of the RRDTool output. I’ll add the localhost to librenms. Any idea how to upgrade RRDTool?
and No for Selinux. Thanks

What does RRDTool Output say beneath the command ?
If it’s only the Memory Usage, Processor Usage and Device Traffic, it could be the same as this #Error Drawing Graphs
If so grab the related snmpd.conf and restart snmpd service and wait for next poll
#SNMP Configuration Examples - LibreNMS Docs
1 Like
Are you using rrdcached? I’ve seen similar issues when people only configure rrdcached in some places.
@murrant My apologies for asking, Is there a place to check where it is configured? What is the best solution to get it resolved?
If you don’t know rrdcached isn’t set up, which is fine.
You should probably answer Chas’ question, he is trying to help you.
1 Like
@Chas: I added this to snmpd.conf:
view systemview included .1.3.6.1.2.1.1
view systemview included .1.3.6.1.2.1.25.1.1
view systemview included .1.3.6.1.4.1.2021
view systemview included .1.3.6.1.2.1.2.2.1
Not sure if this is correct for Red hat 6 or not. Restarted snmpd, now will wait few and check again. Hope this will work for Red Hat 6. Thanks again
I added a linux server to see if I get the same error with the graph as suggested. I can see all the graphs. So is it something to do with Vyatta’s? or the way we pull? or what? Attaching the screenshot. Just frustrating not to get all the graphs for the Vyatta