I apologize if my question has been asked before. I am new to this and dont understand this properly. So please dont mind and help me. It is a request.
I have added a VMware machine and also the guest VMs in it. I am not able to understand the graphs. Librenms is also a guest on it.
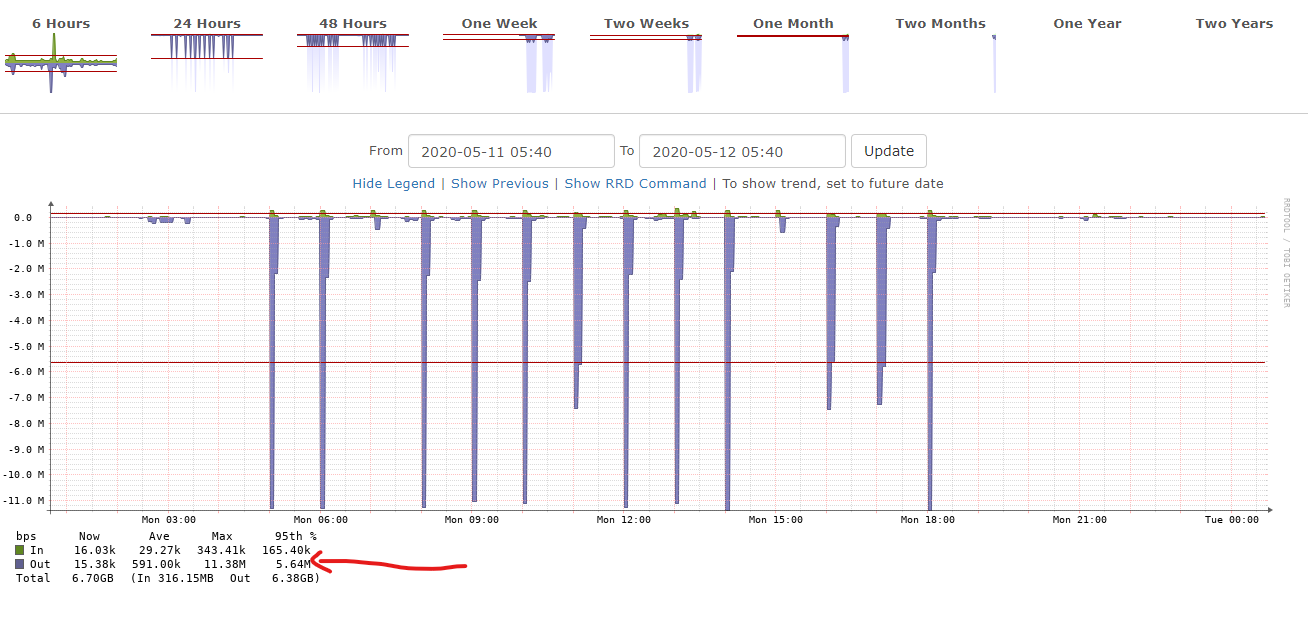
please check the picture, the first picture of of a windows guest. What is the total traffic of the last 24 hours? Please corrrect me if I am wrong, the Is it shows the traffic of the VM right ? And the total is the total data transferred from the interface of the VM.
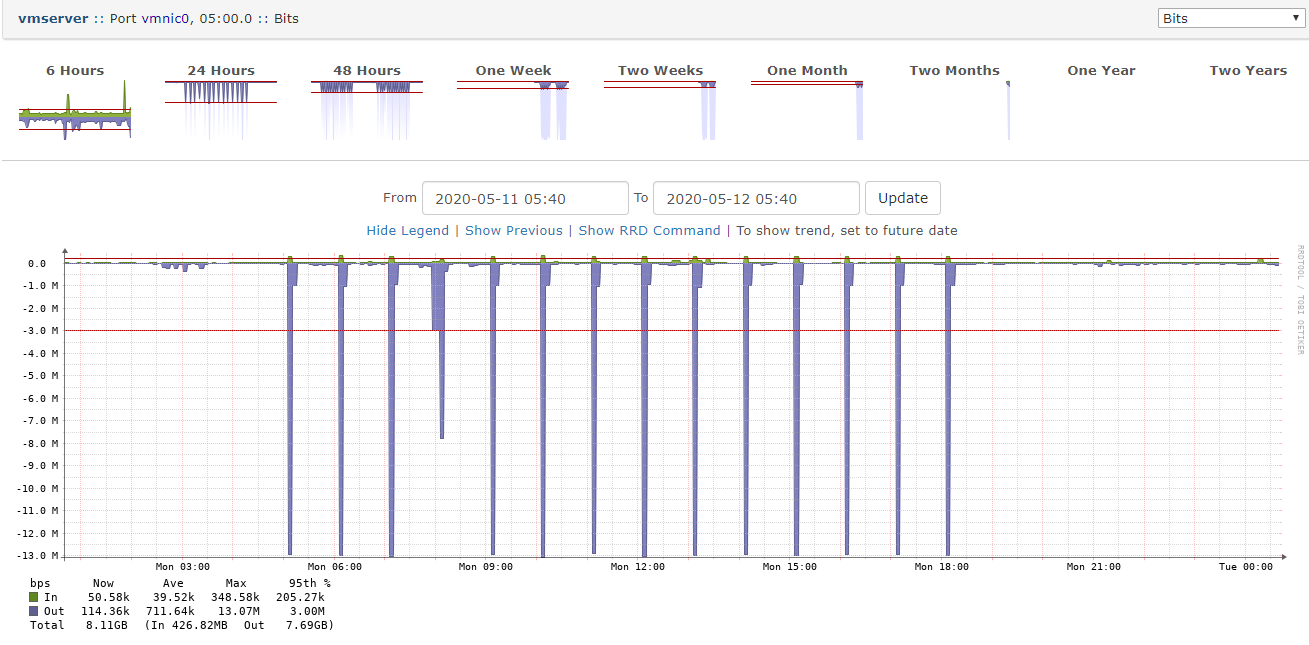
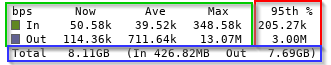
now moving to the main Vmware. this picture is the interface of the host. if that is the case than whats the story here?
The image will be in the next post as I am a new user and cannot put more than 1 image in a post.
Moreover, is there any manual I can read to know more about the definitions and other things about Librenms ?
Regards